

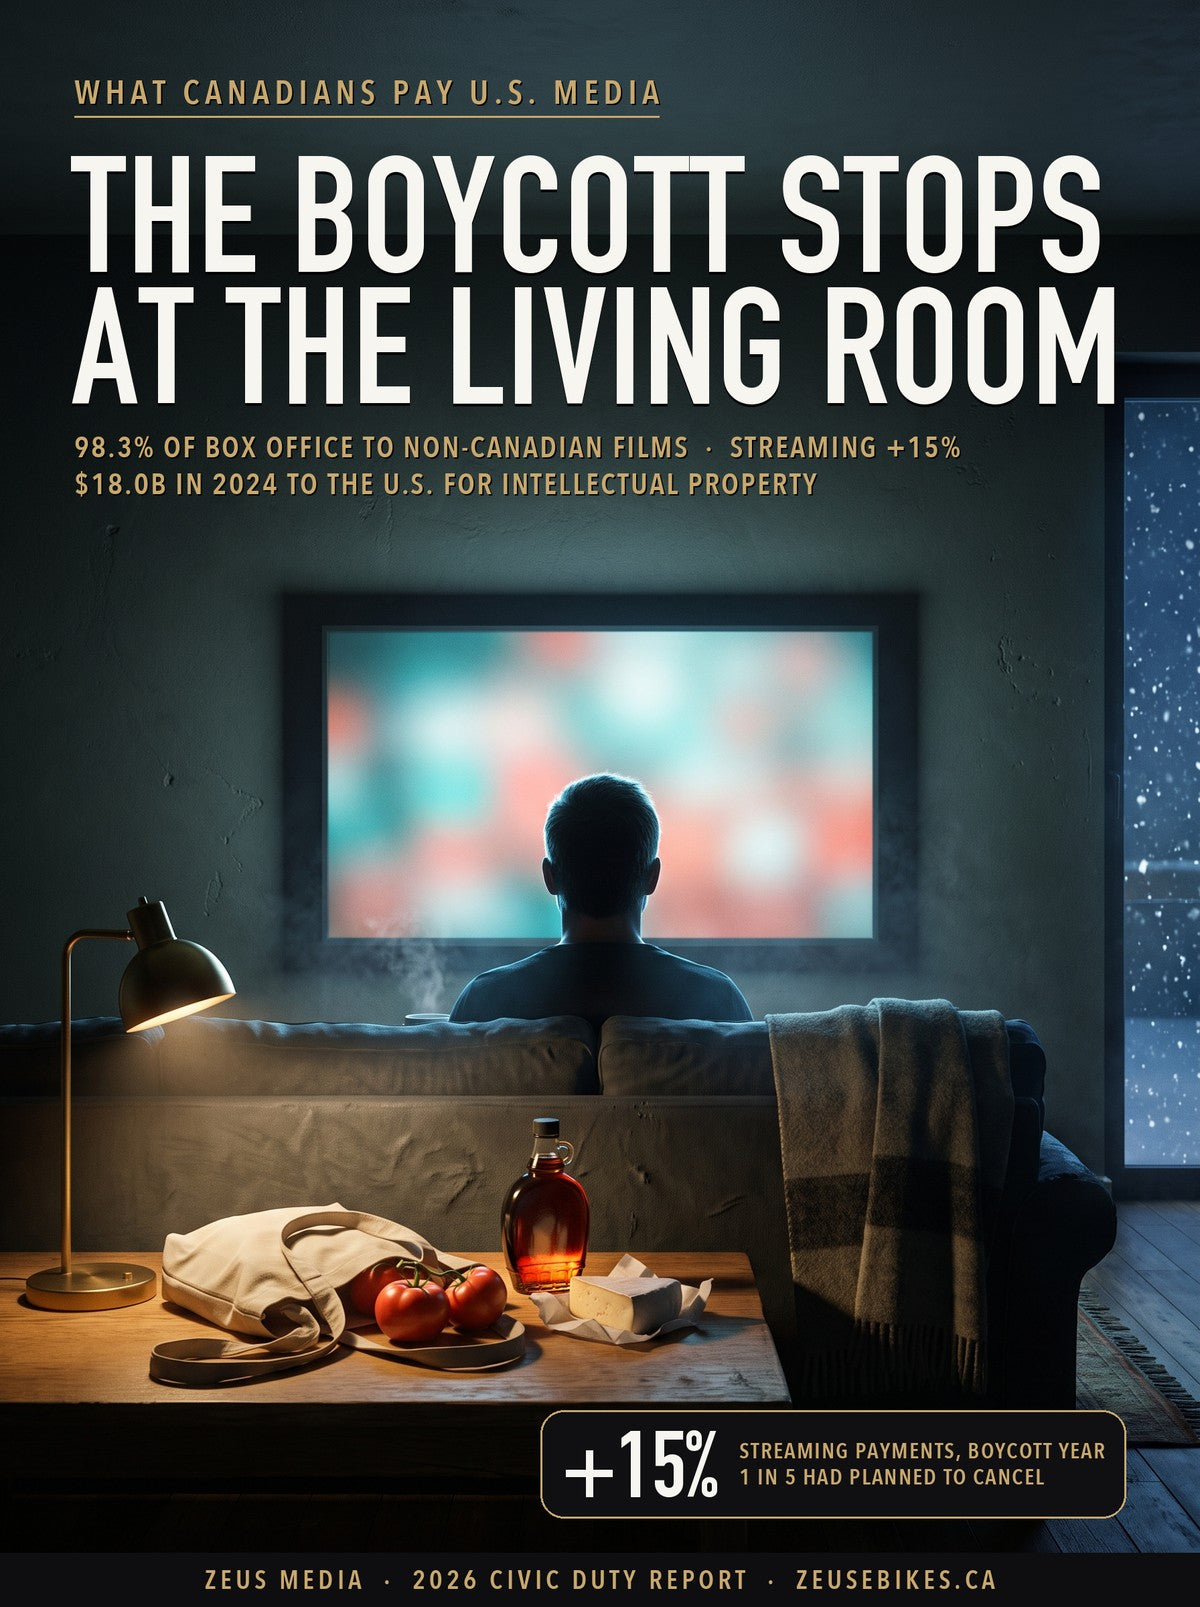
The Boycott Stops at the Living Room: U.S. Media’s Bill to Canada

The boycott on the table, the subscription on the wall. One of these purchases got a national movement; the other got a price increase and kept growing.
Canadians are running a consumer boycott disciplined enough to move markets on both sides of the border. American spirits have been pulled from provincial shelves and their sales have fallen by two-thirds nationally. Sales of U.S.-made food dropped nearly seven per cent in the first months of 2025. Four in five of us told Angus Reid we are buying Canadian on purpose, and grocery aisles now bristle with maple leaves.
Then we walk into the living room, and the boycott ends at the couch: 98.3 cents of every box-office dollar still leaves with films that are not Canadian.
This piece adds up what Canadians actually pay for media from the United States: the movie ticket, the streaming subscription, the cable bill, the pay-per-view fight, the paperback, the video game, the newspaper chain whose biggest shareholder is a New Jersey hedge fund. I pulled the raw tables from Statistics Canada, the CRTC’s own financial books, Telefilm’s box-office census, and the American government’s ledger of what it says we pay them, and computed every load-bearing figure from those files myself; where an industry count is the only measurement that exists, it is used as a count and named where it appears. Where two independent sources could be made to check each other, I ran the check and I show it. Where nobody counts a thing at all, I say so, because the gaps turned out to be some of the loudest findings in the file.
What this piece is. An accounting, not a scolding. It does not tell you to cancel anything. It tells you where the money goes when you spend it, which is information a boycott movement deserves to have and currently does not.
How this was counted. Every load-bearing number was computed from a primary file archived in our research folder, not quoted from a news story.
One. I downloaded sixteen full Statistics Canada tables through the public Web Data Service (the international services accounts, the detailed household spending accounts, the publisher and broadcaster surveys, the official household estimates) and extracted every series in this piece with scripts that fail loudly rather than record a blank as a zero.
Two. I pulled the CRTC’s 2024 statistical and financial books for conventional television, discretionary services and cable distribution from the government’s open-data portal and read the programming-expense lines directly from the workbooks.
Three. Industry counts (Telefilm’s box-office report, Cineplex’s audited results, Convergence Research’s streaming estimates, IFPI’s music figures, BookNet’s print market, the games industry’s own economic study) are used as counts only, each named where it appears. Their conclusions were not consulted.
Four. The build is archived and reproducible: the pull and analysis scripts, the three ledger files (ledger_canada_side.csv, ledger_wallet.csv, ledger_business.csv), the series behind every chart, and a summary file of every derived figure, each carrying its own provenance header with retrieval dates.
Five. Wherever two instruments could measure the same thing, I reconciled them: my streaming estimate computed from Statistics Canada minus the CRTC’s cable books lands within $10 million of Convergence’s independent estimate, Cineplex’s per-patron figures multiply back to its reported box office within 0.02 per cent, and the CRTC’s published sector shares sum to their own total. The checks are in the article, not just behind it. Scripts, raw pulls and derived tables: milad@zeusebikes.ca.
Two disclosures this piece owes you
Our position. Zeus eBikes is a Canadian retailer that benefits when Canadians buy Canadian, and we have published a Buy Canadian investigation before this one. This page carries no products and nothing for sale, but you should read the argument knowing who wrote it. We also advertise nothing on any platform named here, and this article will nonetheless be distributed on at least one of them.
Right of reply. Every claim below rests on a public document or a named organization’s own published figures, so we did not seek comment before publishing — a real limitation, stated. Any company or agency named here can have a correction or response published: milad@zeusebikes.ca.
Quick answer. There is no single official number for what Canadians spend on American media, so we built the ledger ourselves from primary sources. The measurable pieces: Canadians paid roughly $4.8 billion for streaming subscriptions in 2025 (a market led by U.S. services, growing 15% during the boycott), $924 million at the cinema in 2024 — and in 2025, 98.3% of box office went to non-Canadian films, about $11.2 billion for cable, satellite and streaming combined, and $69.99 per UFC pay-per-view. At the border, Statistics Canada records $18.0 billion flowing to the United States in 2024 for intellectual-property charges and $11.1 billion for advertising services, while Canada actually earns a $1.2 billion surplus selling film and TV production work back to the U.S. The full ledgers, and the six numbers nobody publishes at all, are below.
- The aisle and the couch
- The household media wallet, in one table
- The 98-cent movie dollar
- The quiet swap: cable out, streaming in
- The $69.99 country: UFC and the pay-per-view rail
- Video games: the industry that plays both sides
- The app store toll: the checkout counter nobody audits
- Music: where “American” stops being the right word
- Print: the 14% bookshelf and the New Jersey newspaper chain
- The border ledger: what actually crosses
- The business layer: what your cable company sends on
- The six numbers nobody publishes
- Do boycotts work — and is this one aimed where the money is?
- For every $100: what stays, what leaves
- Questions Canadians actually ask
- What this piece cannot tell you
- The bottom line
- How to cite, and revision history
- Sources
The Aisle and the Couch
In late July 2026, with Washington threatening 50 per cent tariffs on Canadian goods under a century-old provision of the Tariff Act, Angus Reid measured the country’s mood and found it unmoved: fewer than one in ten Canadians wanted concessions, and 62 per cent wanted counter-tariffs (Angus Reid Institute, 27 July 2026). The risk in that resolve is spending eighteen months boycotting the shelf while the far larger cultural payment lane hums along untouched, because nobody has ever handed Canadians the actual bill. This article is that bill, ledger by ledger, with the receipts attached.
The boycott’s effects on goods are real and measured. Retail tracking by NielsenIQ, cited in that same Angus Reid release, found sales of U.S.-made food products fell nearly seven per cent in the first part of 2025 while Canadian products gained share despite higher prices. American spirits fell by two-thirds nationally after provinces pulled them, including an 80 per cent decline in Ontario. California’s governor publicly urged Canadian visitors to return, and Kentucky’s asked provinces to put American liquor back on the shelves.
Media spending shows no such dent. Canadian payments for streaming subscriptions grew 15 per cent in 2025 to $4.8 billion, on Convergence Research’s count, and the average price across ten leading services rose seven per cent while subscriptions kept growing (Convergence Research, March 2026). When Angus Reid asked in February 2025 what Canadians planned to change, one in five said they would cancel a streaming service such as Amazon Prime, Netflix or Disney+ — against four in five buying more Canadian groceries (Angus Reid Institute, February 2025). The revenue line a year later suggests most of that one-in-five did not follow through — or that new sign-ups more than replaced the ones who did.
Hold on to this: a grocery dollar spent on an American brand still leaves most of its value in Canada — the store, the trucking, the shelf-stocker, often the factory. A streaming dollar is the closest thing in a household budget to a pure import. The boycott is concentrated on the first kind of dollar and has barely touched the second.
The Household Media Wallet, in One Table
How big is the whole bill? Canadian households spent about $130 billion on recreation and culture in 2024, and the media slice of that wallet is measured, unevenly, across several official instruments. This table is the whole bill as well as it can currently be assembled, with each row’s evidence for how much of it ends up in American hands. No row is guessed; where the split is unpublished, the cell says so.
| Category | Canadians pay | What is actually known about the U.S. share |
|---|---|---|
| Cable, satellite & streaming combined | $11.2B (2024) | Statistics Canada’s household accounts fold streaming into this line. The CRTC’s cable books put traditional TV at $6.4B of it, leaving ~$4.8B for streaming — a market led by U.S. services, with Bell’s Crave the main Canadian exception. |
| Movie theatres | $924M (2024) | 98.3% of 2025 box office went to non-Canadian films; films from major Hollywood studios took about 79% (computed from Telefilm’s figures). Concession money largely stays with Canadian exhibitors. |
| Books | $3.9B (2024, all books) | 14% of print sales were by Canadian authors in 2025 (BookNet). Foreign-controlled publishers took 56.7% of publisher sales in Canada in 2024 (Statistics Canada) — foreign meaning American and German and French. The two columns measure different things: the household account counts all book spending, while BookNet tracks English-language print retail. |
| Newspapers & periodicals | $1.3B (2024) | Down from $2.1B in 2000. The chain with the most titles, Postmedia, has 63% of its shares held by a New Jersey hedge fund. |
| Recorded music | $958M (2025, industry revenue) | $747M of it is streaming. The platforms are American and Swedish; the three global majors that collect most rights revenue are American, Japanese and Dutch-headquartered. “American media” is genuinely the wrong word here — see below. |
| Video games | Not published | No Canadian consumer total exists. The household category that contains games also contains toys and hobbies: $11.2B. The platform owners taking the standard 30% storefront cut are three American companies and one Japanese one. |
| Mobile apps & in-app purchases | Not published (Canada) | Bought through two U.S. storefronts charging up to 30% commission; Apple and Google publish only global figures. Ottawa measured it once, in 2017–18. |
| UFC pay-per-view | $69.99 per event | Thirteen numbered events a year; Canadian buy counts are not disclosed. From 2027 the events move inside Paramount+, an American subscription. |
Sources by row: Statistics Canada tables 36-10-0225 and 21-10-0202; Telefilm Canada, February 2026; CRTC 2024 financial books; BookNet Canada, March 2026; Music Canada / IFPI, 2026; The Canadian Press, June 2026. Full citations in the bibliography.
Per household, the measured lines work out to about $674 a year for cable-satellite-streaming combined, of which streaming alone is roughly $285; $55 at the cinema; $57 for recorded music; and $231 for books — computed against Statistics Canada’s official count of 16.7 million households (table 17-10-0159). Those are averages across all households including the ones that spend nothing, which is why your own streaming bill is probably higher.
The 98-Cent Movie Dollar
Of every dollar Canadians spent at the movies in 2025, 98.3 cents went to films that are not Canadian. That is not a rhetorical flourish; it is the market share arithmetic in Telefilm Canada’s own annual review, built on Comscore data from the Movie Theatre Association of Canada: total box office of $836.9 million, Canadian films $13.9 million, a 1.7 per cent share (Telefilm, Review of Canadian Moviegoing and Distribution, Year 2025).
Outside Quebec it is starker still. On English-language screens, Canadian films held 0.4 per cent of the box office. Quebec’s French-language market — where the top Canadian earner was the comedy Menteuse at $2.6 million — is carrying essentially the entire national number: $11.3 million of the $13.9 million Canadian total.
The two bars of Canadian moviegoing
Box office revenue in Canadian theatres, in millions of dollars, 2016–2025, drawn on one shared scale. The near-invisible gold bars are not a rendering error — that is the actual size of the Canadian share: $13.9 million against $836.9 million in 2025.
Source: Telefilm Canada, Review of Canadian Moviegoing and Distribution, Year 2025 (February 2026), from Movie Theatre Association of Canada / Comscore data. Chart drawn by Zeus from the report’s year-by-year figures.
The one share gaining ground against Hollywood is not Canada’s. Cineplex reports that international films — Japanese, Chinese, Hindi, Punjabi — delivered 11.2 per cent of its 2025 box office, the highest in the company’s history, led by Demon Slayer, Ne Zha 2 and Dhurandhar. At the country’s dominant chain, Tokyo and Mumbai productions now out-earn Canadian cinema several times over, which says less about taste than about what actually gets marketed onto screens here.
Where does the rest go? Telefilm counts 966 new releases in 2025, of which 827 were foreign and just 82 came from major Hollywood studios. Those 82 studio films generated most of the revenue: subtracting the report’s $173 million for independent films of all origins from the $836.9 million total leaves about $664 million — 79 per cent of Canadian box office — flowing to Hollywood-studio releases. Every film in the national top ten was a U.S.-studio production or co-production, led by A Minecraft Movie at $44.9 million. All but one were sequels or adaptations of existing intellectual property, which matters for the border ledger later: the theatrical dollar is increasingly a royalty payment on franchises owned in Los Angeles.
The per-visit receipt comes from Cineplex, which operates about 67 per cent of the national box office. In 2025 its 42.2 million patrons paid a record $13.29 per ticket and a record $9.72 at the concession stand (Cineplex Q4 2025 results, 11 February 2026). The split matters. The ticket revenue is shared with the film’s distributor — and 98 per cent of that revenue was earned by non-Canadian films. The $9.72 popcorn-and-drink line stays with a Canadian exhibitor paying Canadian staff in a Canadian mall. If you have ever wondered why the theatre would rather sell you a combo than a ticket, the ownership of each revenue line is a good part of the answer.
Keep this one: Canadians did not stop going to the movies during the boycott year: box office held at $837 million while attendance slipped less than two per cent. A night at the movies is one of the least substitutable American purchases in Canadian life, because for most of the country there is no Canadian film playing.

The Quiet Swap: Cable Out, Streaming In
Canadian households paid about $11.2 billion in 2024 for what Statistics Canada calls “cable, satellite and other program distribution services” — a line the agency confirms includes streaming subscriptions (Statistics Canada, StatCan Plus). The total has barely moved in a decade. What moved is who collects it, and in which country the collector lives.
The cable side of that line belongs mostly to Canadian companies and is shrinking fast. The CRTC’s 2024 distribution book records $6.44 billion in cable, IPTV and satellite revenue, down 8 per cent in a year, with subscribers down to 9.05 million and the average TV subscriber now paying $711.90 a year — about $59 a month. Convergence Research estimates 48.5 per cent of Canadian households ended 2025 with no traditional TV subscription at all, heading for 57 per cent by 2028.
The streaming side grows as fast as cable shrinks, and here I can show you a check rather than ask for trust. Two instruments that know nothing of each other produce the same number. Subtract the CRTC’s cable-book total from Statistics Canada’s household line and the streaming remainder is $4.79 billion. Convergence Research, counting from the services side across 55 platforms, estimates 2025 Canadian streaming subscription revenue at $4.8 billion, up 15 per cent, on its way past cable itself in 2027.
Behind the revenue line is a behavioural cliff. The CRTC’s market report, citing the Media Technology Monitor, found the share of Canadian households that are streaming-only, with no traditional TV subscription of any kind, jumped from 23 per cent in 2023 to 29 per cent in 2024. Nearly a third of the country’s living rooms now route their entire television life through subscriptions, most of them American-owned.
Who collects the $4.8 billion? The market leader is Netflix, followed by Amazon Prime Video, Disney+, Apple TV+ and Paramount+, American services all, with Bell’s Crave the significant Canadian player. The precise split between Canadian-owned and foreign-owned streamers is one of the numbers nobody publishes, and it goes on the unpublished list below. What a household actually pays, though, is public:
| Service | Price (CAD/month) | Owner |
|---|---|---|
| Netflix | $7.99 with ads · $18.99 standard · $23.99 premium (set January 2025; the March 2026 U.S. increase skipped Canada) | Netflix, Inc. (U.S.) |
| Amazon Prime (includes Prime Video) | $9.99, or $99/year | Amazon (U.S.) |
| Disney+ | $7.99 with ads · $11.99 standard · $14.99 premium | The Walt Disney Company (U.S.) |
| Crave | $9.99 basic · $14.99 standard · $22 premium | Bell Media (Canada) |
| Apple TV+ | $14.99, or $129/year | Apple (U.S.) |
| Paramount+ | $9.99 standard · $13.99 premium — and from 2027, every UFC numbered event | Paramount Skydance (U.S.) |
| YouTube Premium | $12.99 · $22.99 family | Google / Alphabet (U.S.) |
| Spotify Premium | $13.99 individual · $23.99 family (raised May 2026) | Spotify (Sweden) |
| Apple Music | $11.99 individual · $19.99 family (raised 17 July 2026) | Apple (U.S.) |
| DAZN | $24.99 · $44.99 ultimate · $54.99 pro with NFL | DAZN Group (U.K.) |
| Fubo | $31.49 · $54.99 pro with NFL | Fubo (U.S.) |
| Sportsnet+ | $29.99, rising to $34.99 on 22 September 2026 | Rogers (Canada) |
| TSN+ | $29.99 | Bell Media (Canada) |
| UFC Fight Pass | $10.99 | TKO Group (U.S.) |
| Average TV subscription | $59.33 ($711.90/yr, CRTC 2024 ARPU) | Canadian carriers (Rogers, Bell, Telus, Vidéotron…) |
Prices checked 2–3 September 2026 against dated coverage and current plan roundups: MoneySense’s Canadian streaming guide, Curiocity’s 2026 price list, Daily Hive’s sports-streaming cost guide (25 July 2026), and increase coverage from MobileSyrup (Apple Music, 17 July 2026) and MobileSyrup (Spotify, May 2026). Taxes extra throughout.
Stack a household’s typical big five at their mid tiers (Netflix standard, Prime, Disney+ standard, Crave standard, Apple TV+) and the video bill alone is $70.95 a month, about $851 a year, before a single sports service, music plan or tax. Only one of those five is Canadian. Across every household in the country, Convergence’s count of 38 million paid streaming subscriptions works out to about 2.3 subscriptions per household, non-subscribers included — and a sports fan’s stack runs far past $100 a month, which is roughly where the cable bundle it replaced used to sit.
Convergence measured the average price increase across ten leading streamers at 7 per cent in 2025, with ad-supported tiers averaging 42 per cent less than ad-free. Prices marched up through the boycott, and subscriptions grew anyway.
Two grievances from the search data deserve straight answers here. Yes, Netflix Canada’s catalogue is genuinely different from the American one — rights are licensed country by country, which is also why a Canadian VPN industry exists. And no, Netflix does not say what it earns in Canada; no streamer does. Since the Online Streaming Act took effect, services over $25 million in Canadian revenue must file returns with the CRTC, but the regulator publishes only aggregates. From those aggregates: online undertakings took in about $7.1 billion in the 2024 broadcast year, or 36 per cent of all commercial broadcasting revenue in Canada, computed from the CRTC’s own published shares. The figure includes audio services and ad-supported platforms on top of the subscription total above.
There is a counter-mechanism now, and it is not small. On 21 May 2026 the CRTC tripled the required Canadian-content contribution for large streamers from five per cent of Canadian revenue to 15 per cent, a rule expected to stabilize more than $2 billion a year in funding for Canadian and Indigenous content, and one the Globe and Mail noted could deepen the trade rift with Washington (Global News, May 2026; CBC News). Whether it survives the trade war is an open question; the piece to read alongside it is our trade-war playbook.

The $69.99 Country: UFC and the Pay-Per-View Rail
A UFC pay-per-view in Canada costs $69.99 per event, ordered through Sportsnet, and there are thirteen numbered events a year (The Canadian Press, 4 June 2026). A Canadian fan who buys every card pays $909.87 a year — one of the most expensive recurring purchases in Canadian media, and one whose per-country revenue the promotion has never disclosed.
That rail is about to be torn up. In June 2026, UFC and Paramount announced that from January 2027 every numbered-event main card in Canada moves inside Paramount+ for six years, at no extra cost on any tier — the cheapest of which is $7.99 a month (UFC.com, June 2026). Sportsnet and TVA Sports keep the preliminary bouts and the thirty annual Fight Nights. For the all-in fan the arithmetic is startling: $909.87 a year becomes $95.88, a drop of 89 per cent.
Read as a consumer story, that is the best price cut in Canadian sport. Read as a money-flow story, it repeats the swap running through this whole ledger. The pay-per-view model at least routed Canadian fight money through a Canadian broadcaster that publishes Canadian financial returns. From 2027 the same dollars ride an American subscription whose Canadian revenue is not disclosed, bundled so deeply into one bill that no statistical agency will ever see the UFC line inside it. The fight gets cheaper; the ledger gets darker.
The shape of it: across movies, fights and television, the pattern is the same swap — visible, itemized Canadian middlemen replaced by opaque American subscriptions. Each swap is a better deal for the household and a worse one for anyone trying to count where Canadian money goes.
Video Games: The Industry That Plays Both Sides
Nobody publishes what Canadians spend on video games. That absence is itself a finding: the United States industry association reports American consumer spending to the dollar (US$60.7 billion in 2025) while its Canadian counterpart publishes no equivalent, and Statistics Canada’s nearest household category bundles games with toys and hobbies at $11.2 billion. Somewhere inside that envelope is one of the largest unmeasured flows of Canadian money toward American platform owners, because the storefronts collecting the standard 30 per cent cut (Microsoft, Sony, Nintendo, Valve, Apple, Google) are three American companies, two Japanese and no Canadian ones.
What Canada does measure is the other direction, and it is remarkable. The industry’s own economic study, built by Nordicity from a company census, counts 821 studios employing 34,010 people at an average salary of $102,000, contributing $5.1 billion to Canadian GDP, with 88 per cent of revenue earned from exports (ESAC, Canada’s Video Game Industry 2024). Montreal and Vancouver build the games the world plays. The same study’s fine print completes the pattern: 76 per cent of the companies are Canadian-owned, but foreign-owned studios account for 88 per cent of the employment. Canada supplies the labour; the intellectual property, and the margin on it, mostly books elsewhere.
The recurring search question, why are video games so expensive in Canada?, has a boring, verifiable answer: games are priced in U.S. dollars first, and the Bank of Canada’s average exchange rate in 2025 was 1.3978. A US$69.99 release converts to about C$98 before tax. The premium is the exchange rate plus the platform cut; there is no Canadian tariff on video games to blame.

The App Store Toll: The Checkout Counter Nobody Audits
Almost everything this article has counted — the streaming plans, the music, a growing share of the games — can be bought through exactly two checkout counters: Apple’s App Store and Google Play. Both are American. Both charge the merchant a commission of up to 30 per cent on digital goods, reduced to 15 per cent for smaller developers and most ongoing subscriptions (Apple’s published program terms), and no Canadian figure for what flows across either counter has ever been published.
Only the global scale is public, and it is enormous. Sensor Tower counted US$167 billion in worldwide in-app spending in 2025, the first year non-game apps out-earned games on mobile (TechCrunch, January 2026). Apple’s own commissioned study says its ecosystem facilitated US$1.4 trillion in billings and sales in 2025, of which US$149 billion was digital goods and services, the slice where its commission applies, and the company is careful to note that more than 90 per cent of the total (physical goods, ads) pays it nothing (Apple Canada newsroom, June 2026). What neither company breaks out, anywhere, is Canada.
The one time Canada’s statistical agency measured this directly was a single survey covering July 2017 to June 2018: nearly 80 per cent of Canadian adults used or bought digital products, and purchasers spent $2.0 billion on digital video alone that year (Statistics Canada, Digital Economy Survey). That instrument ran once, eight years ago; the global in-app market has more than doubled since on Sensor Tower’s own series. Today the only parties who know the Canadian app-store number are the two platforms and the private trackers who sell country estimates by subscription — which is why it joins the unpublished ledger below as a sixth row.
One mechanical detail makes the toll worth seeing clearly. When a subscription is sold inside an app, a Canadian’s payment carries two margins instead of one: the storefront’s cut on top of the service’s own. The biggest services have learned to route around it — Netflix pulled its sign-ups out of Apple’s in-app billing back in 2018 (The Verge) — but for thousands of smaller apps, games and tools, the American checkout counter takes its share of the Canadian dollar before the merchant sees a cent.
The counter and the till: Canada debated for years whether foreign streamers should contribute here, and built a 15 per cent rule. The two storefronts through which Canadians buy their apps, in-app upgrades and many of their subscriptions have never faced the equivalent conversation — partly because nobody can put a Canadian number on them.
Music: Where “American” Stops Being the Right Word
Canada’s recorded-music market reached $957.9 million in 2025, its eleventh straight year of growth, with streaming carrying $747 million of it ($598.5 million in subscriptions, $148.3 million ad-supported) and vinyl driving physical sales up 15.9 per cent to $122.2 million (IFPI Global Music Report 2026, via Music Canada). Canada is the ninth-largest music market on earth.
Here the honest count breaks the article’s own framing, and it should. The biggest subscription platform in Canada, Spotify, is Swedish. Of the three global majors that collect the bulk of rights revenue, Universal is headquartered in the Netherlands, Sony Music answers to Tokyo, and only Warner is American. Apple, Amazon and YouTube, the other platforms, are American, and a large share of major-label operations run through the U.S., but a Canadian who cancelled Spotify to punish Washington would mostly be inconveniencing Stockholm. If the goal is precision about where media money lands, music is the category where “American” is least accurate — and I am not going to flatten that to make a cleaner thesis.
The Canadian counter-flow here is old and new at once. Radio has carried Canadian-content quotas since 1971; the question the CRTC calls “forthcoming” is how, and whether, an equivalent obligation lands on the streaming platforms now that the 15 per cent contribution rule exists for video. Meanwhile Canadian artists earn globally through the same pipes: Spotify’s own Canadian royalty report claims 19 per cent year-over-year growth for Canadian artists on the platform — a company’s self-published number, noted as such.
Print: The 14% Bookshelf and the New Jersey Newspaper Chain
Canadians bought about $1.145 billion of print books in 2025 (nearly 48 million of them), and 14 per cent were written by Canadians, a share that rose two points in the boycott year, which BookNet itself connects to the buy-Canadian mood (BookNet Canada, 31 March 2026). Publishers owned in Canada took 6.2 per cent of retail sales. Statistics Canada’s biennial publisher survey tells the industry side: of $999.3 million in 2024 publisher sales in Canada, foreign-controlled firms took $567.1 million — 56.7 per cent (table 21-10-0202).
Precision again complicates the villain. Of the five conglomerates that dominate English-language publishing, two are American (HarperCollins, Simon & Schuster), two German-owned (Penguin Random House, Macmillan) and one French (Hachette). And the counter-flow row is genuinely good news: Canadian-controlled publishers export more than their foreign-controlled counterparts — $266.5 million against $105.8 million in 2024, a gap that has widened every survey since 2020. Canadian houses sell Canadian books to the world at two and a half times the rate the multinationals ship out of here.
Newspapers are the bleakest line in the household ledger, and the sharpest answer to a question Canadians keep typing into the search bar: who owns Canadian media? Household spending on newspapers and periodicals has fallen from $2.1 billion in 2000 to $1.3 billion in 2024 in current dollars. Within what remains, the largest chain by number of titles, Postmedia (publisher of the National Post, the Vancouver Sun, the Ottawa Citizen, the Calgary Herald and the Edmonton Journal), has 63 per cent of its publicly traded shares held by the New Jersey hedge fund Chatham Asset Management, which controls 31 per cent of the voting rights, a structure that keeps majority foreign ownership onside with Canadian voting rules. Who owns what across the whole economy is a bigger census than this section — we ran it name by name in our foreign-asset audit of Canada. Within news media, the rest of the landscape is more Canadian than the anxiety suggests: the Globe and Mail (Woodbridge), the Toronto Star (NordStar), Le Devoir, and the broadcast groups Bell, Rogers, Corus and Québecor are Canadian-owned, and CBC/Radio-Canada is public. Who funds those Canadian newsrooms, and what that does to them, is its own investigation — we published it as Canada’s broken sensors.

The Border Ledger: What Actually Crosses
Everything so far counts what leaves a Canadian wallet. The balance of payments counts what leaves the country, and it reorganizes the story. In 2024, on Statistics Canada’s ledger, Canada imported $129.6 billion in services from the United States and exported $119.6 billion back (table 36-10-0007). Three lines inside that flow are the media story.
The first line is the rights bill, and it is the largest. Charges for the use of intellectual property paid to the U.S. reached $18.0 billion in 2024, against $6.3 billion coming back — a deficit of $11.7 billion that has doubled since 2019. Not all of it is media: the copyright line closest to film, television, music and books ran $1.8 billion in 2023, software royalties $5.2 billion, and the remainder is patents, industrial R&D, franchises and trademarks. But this is the ledger where a franchise-heavy box office, a licensed-in streaming catalogue and a game bought on an American storefront ultimately land.
The rights bill: what Canada pays the U.S. to use its intellectual property
Canada’s imports of “charges for the use of intellectual property” from the United States, 1990–2024, in billions of dollars — every licence fee crossing the border: film and music copyright, software royalties, franchises, patents. The gold segment is 2019 onward: $11.3 billion to $18.0 billion in five years.
Source: Statistics Canada table 36-10-0006-01, “United States, all transactions,” retrieved 2 September 2026 and charted by Zeus. Not all of this is media — the copyright line closest to film, TV, music and books was $1.8 billion in 2023, software royalties $5.2 billion; the rest is patents, R&D licensing, franchises and trademarks.
The second line Canada wins, and almost nobody talks about it. In audio-visual services, the actual work of production, Canada sold the United States $3.6 billion in 2024 and bought $2.4 billion, a Canadian surplus of $1.2 billion that has held since the mid-2010s. That is Hollywood North on the national books: Vancouver soundstages, Toronto crews, Montreal effects houses billing American studios. The same country that keeps 1.7 per cent of its own box office is a net exporter of film and television work to the people who take the other 98.3 per cent. Canada gets the payroll; Los Angeles keeps the copyright, and the copyright is where the recurring money lives — which is what the first line just showed.
The one Hollywood ledger Canada wins
Canada’s audio-visual services trade with the United States, 1990–2024, billions of dollars, one shared scale — the “Hollywood North” production work Canada sells against the audio-visual services it buys. The lines cross for good in the mid-2010s; in 2024 Canada sold $3.6 billion and bought $2.4 billion.
Source: Statistics Canada table 36-10-0006-01, audio-visual and related services, “United States, all transactions,” retrieved 2 September 2026, charted by Zeus. The services surplus does not include the rights payments in the previous chart — that is the point.
The third line is advertising, and for years Canada could not even see it. Imports of advertising services from the U.S. ran $11.1 billion in 2024, with a $6.6 billion deficit. The series appears to explode from $795 million in 2019 to $8.5 billion in 2020, and the table’s own footnote explains why: starting that year, Statistics Canada expanded coverage “to better capture the extent of Canadian payments to foreign entities for online advertising made on social media, internet browser, etcetera.” The money — much of it Google and Meta invoices paid by Canadian businesses, whose cost lands in Canadian prices — was flowing all along. The national instrument was blind to roughly eight billion dollars a year of it until 2020.
The advertising pipe, once Statistics Canada could finally see it
Canada’s imports of advertising and related services from the United States, 2012–2024, billions of dollars. The dashed rule marks a measurement change, not a market change: from reference year 2020, Statistics Canada expanded coverage “to better capture the extent of Canadian payments to foreign entities for online advertising made on social media, internet browser, etcetera.” The money was flowing before 2020 — the instrument could not see it.
Source: Statistics Canada table 36-10-0006-01, advertising and related services, imports, “United States, all transactions,” with the table’s own footnote 9 quoted above. Retrieved 2 September 2026, charted by Zeus.
The American books tell a compatible story with different numbers. The U.S. Bureau of Economic Analysis records US$1.81 billion of “rights to use audiovisual products” sold to Canada in 2025 — about C$2.5 billion — plus US$1.3 billion in audiovisual reproduction licences and US$5.4 billion in software including end-user licences (BEA international services tables, July 2026 release). The two national ledgers disagree in detail, as mirror statistics always do, and one reason deserves plain language: a subscription billed to a Canadian card by a multinational’s Dutch or Irish entity leaves Canada without ever appearing as a Canada–U.S. transaction. Bilateral tables put a floor under the flow, not a ceiling.
The two-line summary: the “how much do we send them” question has a two-part answer. Services overall are near balance — $89.1 billion of commercial imports against $91.7 billion of exports in 2024. The media-shaped lines inside it are lopsided in specific, opposite ways: Canada wins the work, and pays for the rights.
The Business Layer: What Your Cable Company Sends On
A household’s $59-a-month TV subscription starts a second journey after Rogers or Bell collects it, and the CRTC’s books let us follow the first hop. In the 2024 broadcast year, cable and satellite distributors paid $3.18 billion in affiliation fees to the channels they carry. The Canadian television services on the other end of those fees, together with the ad-funded networks, spent $1.19 billion of their programming budgets on non-Canadian programming — $493 million by conventional networks and $696 million by discretionary channels, concentrated in drama, films and sports. The CRTC’s categories say “non-Canadian” rather than naming countries; anyone who has watched a Canadian network’s prime-time schedule can judge how much of it is not American.
For scale: all commercial broadcasting in Canada (radio, TV, cable and the online undertakings together) took in about $19.6 billion in 2024, and the online share became the largest single sector at 36 per cent, larger than cable itself. Every traditional segment’s revenue fell; the online segment grew 14.5 per cent. The system Ottawa spent seventy years regulating into Canadian hands is being replaced, subscription by subscription, with one regulated since 2023 and headquartered somewhere else.
The Six Numbers Nobody Publishes
Counting this ledger honestly means naming where counting fails. Six numbers a reader would reasonably expect to exist do not exist in public, and each absence has an owner.
| The missing number | Why it’s missing |
|---|---|
| What Netflix (or any streamer) earns in Canada | Streamers over $25M must now file with the CRTC, but the regulator publishes only aggregates. Company geographic reporting stops at “US & Canada.” |
| How much of the $3.18B in affiliation fees goes to U.S. channels | Foreign services authorized for Canadian carriage file no Canadian financial returns at all. |
| Canadian consumer spending on video games | No agency or association publishes it; the household category bundles games with toys. |
| Canadian UFC pay-per-view buys | Never disclosed by promoter or broadcaster; from 2027 the line dissolves into Paramount+ subscriptions entirely. |
| What Canadians pay through the two app stores | Apple and Google publish global ecosystem figures only; the country splits exist solely as private trackers’ paid estimates. Ottawa’s one direct measurement ran once, in 2017–18. |
| Pre-2020 digital advertising outflows | Statistics Canada’s own footnote: coverage of payments to foreign platforms was expanded only from reference year 2020. The prior series understates the flow by billions. |
That asymmetry is not an accident of difficulty: two rows of that table sit in filings the CRTC already collects and treats as confidential. What gets counted in public is a choice, made mostly before the money moved online, and never revisited.

Do Boycotts Work — and Is This One Aimed Where the Money Is?
Do consumer boycotts work? The measured Canadian answer from the past eighteen months: yes, remarkably well, where three conditions line up — a visible origin label, an easy substitute, and a purchase made in public. U.S. food sales down seven per cent with Canadian products gaining share at higher prices; American spirits down two-thirds; and half of Canadians telling the pollster they would cancel or delay trips into the U.S. By consumer-research standards those are extraordinary swings, and they happened in categories where every one of those three conditions holds.
Media fails all three conditions at once. A streaming charge renews invisibly on a saved credit card. The substitute for a Hollywood franchise or an NFL Sunday mostly does not exist — you cannot buy the Canadian Minecraft Movie. And nobody sees your subscriptions in your cart. So the boycott behaves the way those three conditions predict: 46 per cent of grocery shoppers actively check origins, one in five even planned to touch streaming, and the streaming line grew 15 per cent. None of that is hypocrisy. It is what happens when a movement runs on visibility and one category is built to be invisible.
Whether media is where a boycott should aim is a different question, and the ledger cuts both ways. The dollars are large and unusually pure exports; they are also attached to the one sector where Canada earns a billion-dollar surplus selling work back, and to platforms that now owe 15 per cent of Canadian revenue to Canadian content by regulation. A cancelled subscription pressures a U.S. platform; it also shrinks the base that funding rule draws on. This article’s job is the ledger, not the instruction. What it can say flatly is that a movement which believes it is pressuring America while leaving these lines untouched has not seen the sizes involved — and now the sizes are public.
For Every $100: What Stays, What Leaves
The translation table below is the article in miniature: each row says what is measured about where $100 of Canadian spending in that category ends up. Cells marked “not published” are exactly that — refusing to invent them is the point of this piece.
| You spend $100 on… | Documented to stay in Canada | Documented to leave |
|---|---|---|
| Movie tickets | The exhibitor’s share of the ticket — theatres, staff, screens are Canadian; concessions stay almost entirely. | $98.30 of box office is earned by non-Canadian films, whose distributor share flows out as rights revenue; ~$79 sits with Hollywood-studio releases. |
| Streaming subscriptions | The new 15% CanCon contribution on large streamers’ Canadian revenue; Crave’s share of the market (size not published). | The remainder of every U.S.-service subscription — the closest thing in this table to a pure import. |
| Cable/satellite TV | Most of it: Canadian carriers, Canadian channels, $1.9B in Canadian programming spend by TV services. | $1.19B/yr in non-Canadian programming purchases; an unpublished slice of $3.18B in affiliation fees to U.S. channels. |
| Books | Canadian retail; 43.3% of publisher sales (Canadian-controlled firms); 14% of print sales by Canadian authors. | 56.7% of publisher sales via foreign-controlled firms (U.S., German, French), plus rights payments on the 86% of books not Canadian-authored. |
| Recorded music | Canadian artists’ royalties; live music (not in this ledger). | Platform margins (U.S./Sweden) and the majors’ share of $747M in streaming (U.S./Japan/Netherlands). |
| UFC pay-per-view | Sportsnet’s distribution share until 2027 (size not published). | The promotion’s share to a U.S. company; from 2027, the whole line inside Paramount+. |
| Video games | $5.1B of GDP and 34,010 jobs on the making side — but funded by exports, not by your purchase. | The ~30% storefront cut (U.S./Japanese platforms) plus the publisher’s share; consumer flow itself unmeasured. |
Questions Canadians Actually Ask
How much money does Canada send to the U.S. every year?
For services, Statistics Canada’s 2024 ledger shows $129.6 billion of imports from the U.S. against $119.6 billion of exports — and $30.1 billion of that import line is Canadian travel spending inside the United States. Commercial services are close to balanced. The one-sided flows hide inside: $18.0 billion out for intellectual-property charges and $11.1 billion for advertising services, against a $1.2 billion Canadian surplus on audio-visual production work.
How much does the average Canadian household spend on streaming services?
About $285 a year on subscription streaming, computed as Convergence Research’s $4.8 billion national estimate for 2025 divided across Statistics Canada’s 16.85 million households. Averaged over every household including non-subscribers — a two-service household at typical 2026 prices pays roughly double that.
How much is UFC pay-per-view in Canada?
$69.99 per numbered event through Sportsnet, roughly $910 a year for all thirteen. From January 2027, numbered-event main cards in Canada move inside Paramount+ at no added cost, on plans starting at $7.99 a month; Sportsnet and TVA Sports keep prelims and Fight Nights.
Why do Canadian movies make so little at the box office?
Distribution and scale more than quality: 82 Hollywood-studio releases took about 79 per cent of 2025’s $836.9 million box office, backed by franchise IP and marketing budgets no Canadian film approaches. Canadian films held 1.7 per cent nationally — 13 per cent on Quebec’s French-language screens, where a star system and audience loyalty exist, and 0.4 per cent on English screens, where they largely do not.
Who owns Canadian media?
Broadcasting is mostly Canadian-owned by law (Bell, Rogers, Corus, Québecor), plus the public CBC/Radio-Canada. The Globe and Mail and Toronto Star have Canadian owners. The largest newspaper chain by titles, Postmedia, has 63 per cent of its shares held by New Jersey hedge fund Chatham Asset Management, which holds 31 per cent of the voting rights. The streaming services taking the largest new share of attention are American, with Bell’s Crave the main exception.
Do boycotts actually work?
The Canadian evidence from 2025–26 is that they work powerfully where origin is visible and substitutes exist: U.S. food sales fell about seven per cent and American spirits fell by two-thirds after provinces delisted them. They barely register where billing is invisible and substitutes are scarce — streaming payments grew 15 per cent in the same period.
Is Netflix Canada different from Netflix US?
Yes. Catalogues are licensed country by country, so titles differ; prices differ too. Canadian plans have been $7.99 (ads), $18.99 (standard) and $23.99 (premium) since January 2025 — Netflix’s March 2026 U.S. increase did not apply in Canada. What Netflix earns in Canada is not disclosed.
Why are video games so expensive in Canada?
Games are priced in U.S. dollars and converted: at 2025’s average exchange rate of 1.3978, a US$69.99 title lands near C$98 before tax. Add provincial sales tax and the platform storefront’s cut and the sticker is set almost entirely outside Canada. There is no import tariff on video games.
How much does cable cost per month in Canada?
The average TV subscriber paid $711.90 a year in the 2024 broadcast year (about $59 a month) on the CRTC’s books, down from $792 in 2020 as households trim packages. About 48.5 per cent of households now have no traditional TV subscription at all.
What is Canada’s services trade deficit with the U.S.?
Roughly $10 billion overall in 2024 ($129.6 billion in, $119.6 billion out), driven mostly by travel. Commercial services alone are nearly balanced (an $89.1 billion / $91.7 billion split in Canada’s modest favour), while the IP-charges line runs an $11.7 billion deficit and audio-visual production services run a Canadian surplus.
How much do streaming services cost in Canada per month?
Checked September 2026: Netflix $7.99–$23.99, Amazon Prime $9.99, Disney+ $7.99–$14.99, Crave $9.99–$22, Apple TV+ $14.99, Paramount+ from $9.99, YouTube Premium $12.99, Spotify $13.99, Apple Music $11.99, DAZN from $24.99 and Sportsnet+ $29.99 (rising to $34.99 on 22 September). A typical big-five video stack runs about $71 a month before tax — and only Crave in that stack is Canadian.
How much do Canadians spend on apps and in-app purchases?
No official Canadian figure exists — that is one of this article’s six unpublished numbers. Globally, in-app spending hit US$167 billion in 2025 (Sensor Tower), and Apple says its ecosystem facilitated US$149 billion in commissionable digital goods worldwide. Statistics Canada measured Canadian digital purchases exactly once, in 2017–18, when digital video alone drew $2.0 billion. The storefronts taking up to a 30 per cent cut are both American.
How much do Canadians spend at the movies each year?
$836.9 million at the national box office in 2025, plus concessions — Cineplex alone sold $410 million of food and drink to 42.2 million patrons. Per visit at Cineplex: a record $13.29 ticket and $9.72 concession, about $23 a head.
What This Piece Cannot Tell You
The gaps, so nobody has to discover them for me. The six unpublished numbers above are the big ones. Beyond those: the “U.S. share” of streaming is characterized from market structure, not computed, because the Canadian/foreign revenue split is not public. The year bases differ across instruments — calendar 2024 for national accounts, the September–August 2024 broadcast year for the CRTC, calendar 2025 for Telefilm, Convergence, IFPI and BookNet — so the ledgers sit side by side rather than summing to one grand total, and any single “Canadians send $X billion to U.S. media” headline would be less honest than this table of parts. Postmedia’s ownership share is reported from its public filings via press coverage, not recomputed from the register. And the three consumer ledgers deliberately do not add across layers: a dollar in your cable bill reappears inside the affiliation and programming flows, and adding those together would count it twice.
The Bottom Line
Canadians built a boycott that moved grocery markets on two continents, and it never reached the couch — not out of weakness, but because nobody had put the couch on the bill. The bill now exists. The theatre dollar is 98 per cent not-Canadian. The streaming line is $4.8 billion, growing through the boycott, mostly American-owned, newly required to put 15 per cent of Canadian revenue into Canadian content. The rights bill at the border is $18 billion and doubling on a five-year clock, while Canadian crews earn a genuine surplus making American shows. And six numbers a citizen would need to see the whole picture are published nowhere at all.
Do with the ledger what you like — that part is yours. If this kind of accounting is useful, the siblings to this piece follow the same money through foreign auto companies, the goods aisle, and the negotiating table. Every table, script and raw pull behind this article is archived and reproducible; any of it is available by asking: milad@zeusebikes.ca. If we got a number wrong, show us and we will correct it in place, dated.
Visuals created by Playcut.ai
How to Cite This Article, and Its Revision History
Suggested citation: Ghobadibeygvand, M. (2026). The Boycott Stops at the Living Room: U.S. Media’s Bill to Canada. Zeus Media (Civic Duty). https://zeusebikes.ca/blogs/news/canada-us-media-spending. First published 2 September 2026; revised 3 September 2026. The underlying dataset (three ledger files, chart series and validation summary, with per-file provenance and retrieval dates) is archived and available on request: milad@zeusebikes.ca.
Revision history. Corrections here are published, not buried.
v1 — 2 September 2026. First publication.
v2 — 2 September 2026. Added the full subscription-stack price table, the app-store section, a sixth row to the unpublished ledger, and two FAQ entries.
v4 — 3 September 2026. The hero statistics bar was rendering its numbers dark-on-dark with the labels run together (a markup defect against the stylesheet’s contract) — fixed here and in one earlier article carrying the same defect. The cover photograph was replaced with a stronger frame; the image and its description changed, the facts did not.
v3 — 3 September 2026. Five-desk editorial review. All four charts redrawn after visual QA (clipped year labels, on-chart annotations colliding with data lines, missing legends and baseline). Precision corrections: NielsenIQ food-sales period restated as “first months of 2025”; “non-game apps out-earned games” scoped to mobile; the one-in-five cancellation inference now states the offsetting-sign-ups alternative; the books row notes its two instruments measure different things; subscription-stack maths labelled as mid tiers; per-household subscription average prefixed “about.” Headline clarified from “Canada Bill” to “Bill to Canada.”
Sources
- Statistics Canada, table 36-10-0006-01, International transactions in services, commercial services by category — retrieved via the Web Data Service, 2 September 2026 (includes footnote 9 on the 2020 advertising coverage expansion).
- Statistics Canada, table 36-10-0007-01, International transactions in services, by selected countries — retrieved 2 September 2026.
- Statistics Canada, table 36-10-0225-01, Detailed household final consumption expenditure — retrieved 2 September 2026; and “The medium is cheaper — but the message is pricier” (StatCan Plus), confirming streaming is included in the program-distribution category.
- Statistics Canada, table 17-10-0159-01, household estimates and table 17-10-0005-01, population estimates — retrieved 2 September 2026.
- Statistics Canada, table 21-10-0202-01, book publishers by country of control — retrieved 2 September 2026.
- CRTC, Statistical and Financial Summaries for the Broadcasting Sector, 2024 (conventional television, discretionary and on-demand, and distribution workbooks, via the Government of Canada open-data portal) — downloaded 2 September 2026.
- CRTC, Annual highlights of the broadcasting sector 2023–2024 — sector revenue shares, online-undertaking growth, and MTM streaming-only household figures.
- Telefilm Canada, Review of Canadian Moviegoing and Distribution, Year 2025 (February 2026), on Movie Theatre Association of Canada / Comscore data.
- Cineplex Inc., Fourth Quarter and Annual 2025 Results (11 February 2026).
- Convergence Research, The Battle for the Canadian Couch Potato: OTT and TV (March 2026), public summary.
- Music Canada, IFPI Global Music Report 2026: Canada figures (2026).
- BookNet Canada, Sales of books by Canadian authors and Canadian publishers up in 2025 (31 March 2026).
- Entertainment Software Association of Canada / Nordicity, Canada’s Video Game Industry 2024; Entertainment Software Association (U.S.), 2025 U.S. consumer spending on video games.
- Angus Reid Institute, Shopping Shift (February 2025) and tariff-response survey (27 July 2026, incl. NielsenIQ retail figures).
- UFC, Paramount and UFC expand partnership to Canada beginning in 2027 (June 2026); The Canadian Press via paNOW (4 June 2026).
- Global News, Major streamers must pay 15% of revenues to Canadian content; CBC News, CRTC raising required cash contributions from online streamers (May 2026).
- U.S. Bureau of Economic Analysis, International services (expanded detail), trade in services by country, 2025 (release of 7 July 2026); table 2.3 extract for Canada archived in our research folder.
- Bank of Canada, Valet API, series FXUSDCAD — 2024 and 2025 daily averages computed 2 September 2026.
- Netflix Canada pricing: CBS News on the March 2026 U.S. increase and January 2025 Canadian pricing; Spotify: MobileSyrup, May 2026.
- Postmedia ownership: The Globe and Mail on Postmedia’s ownership and debt; CWA Canada open letter (September 2025).
- Apple, App Store ecosystem reaches $1.4 trillion as developers thrive globally (Canada newsroom, June 2026); Apple, App Store Small Business Program terms.
- TechCrunch, Consumers spent more on mobile apps than games in 2025 (21 January 2026, on Sensor Tower data).
- The Verge, Netflix stops offering in-app subscriptions on iOS (28 December 2018).
- Statistics Canada, How are Canadians spending online? (Digital Economy Survey, July 2017–June 2018).
- Subscription pricing, checked 2–3 September 2026: MoneySense; Curiocity; Daily Hive sports-streaming cost guide (25 July 2026); MobileSyrup on the Apple Music increase (17 July 2026); Milesopedia’s 2026 Amazon Prime guide.



Share:
The School in Minab, and the Word Canada Won't Say
Michael Cooper's Trade-War Video, Fact-Checked Line by Line