

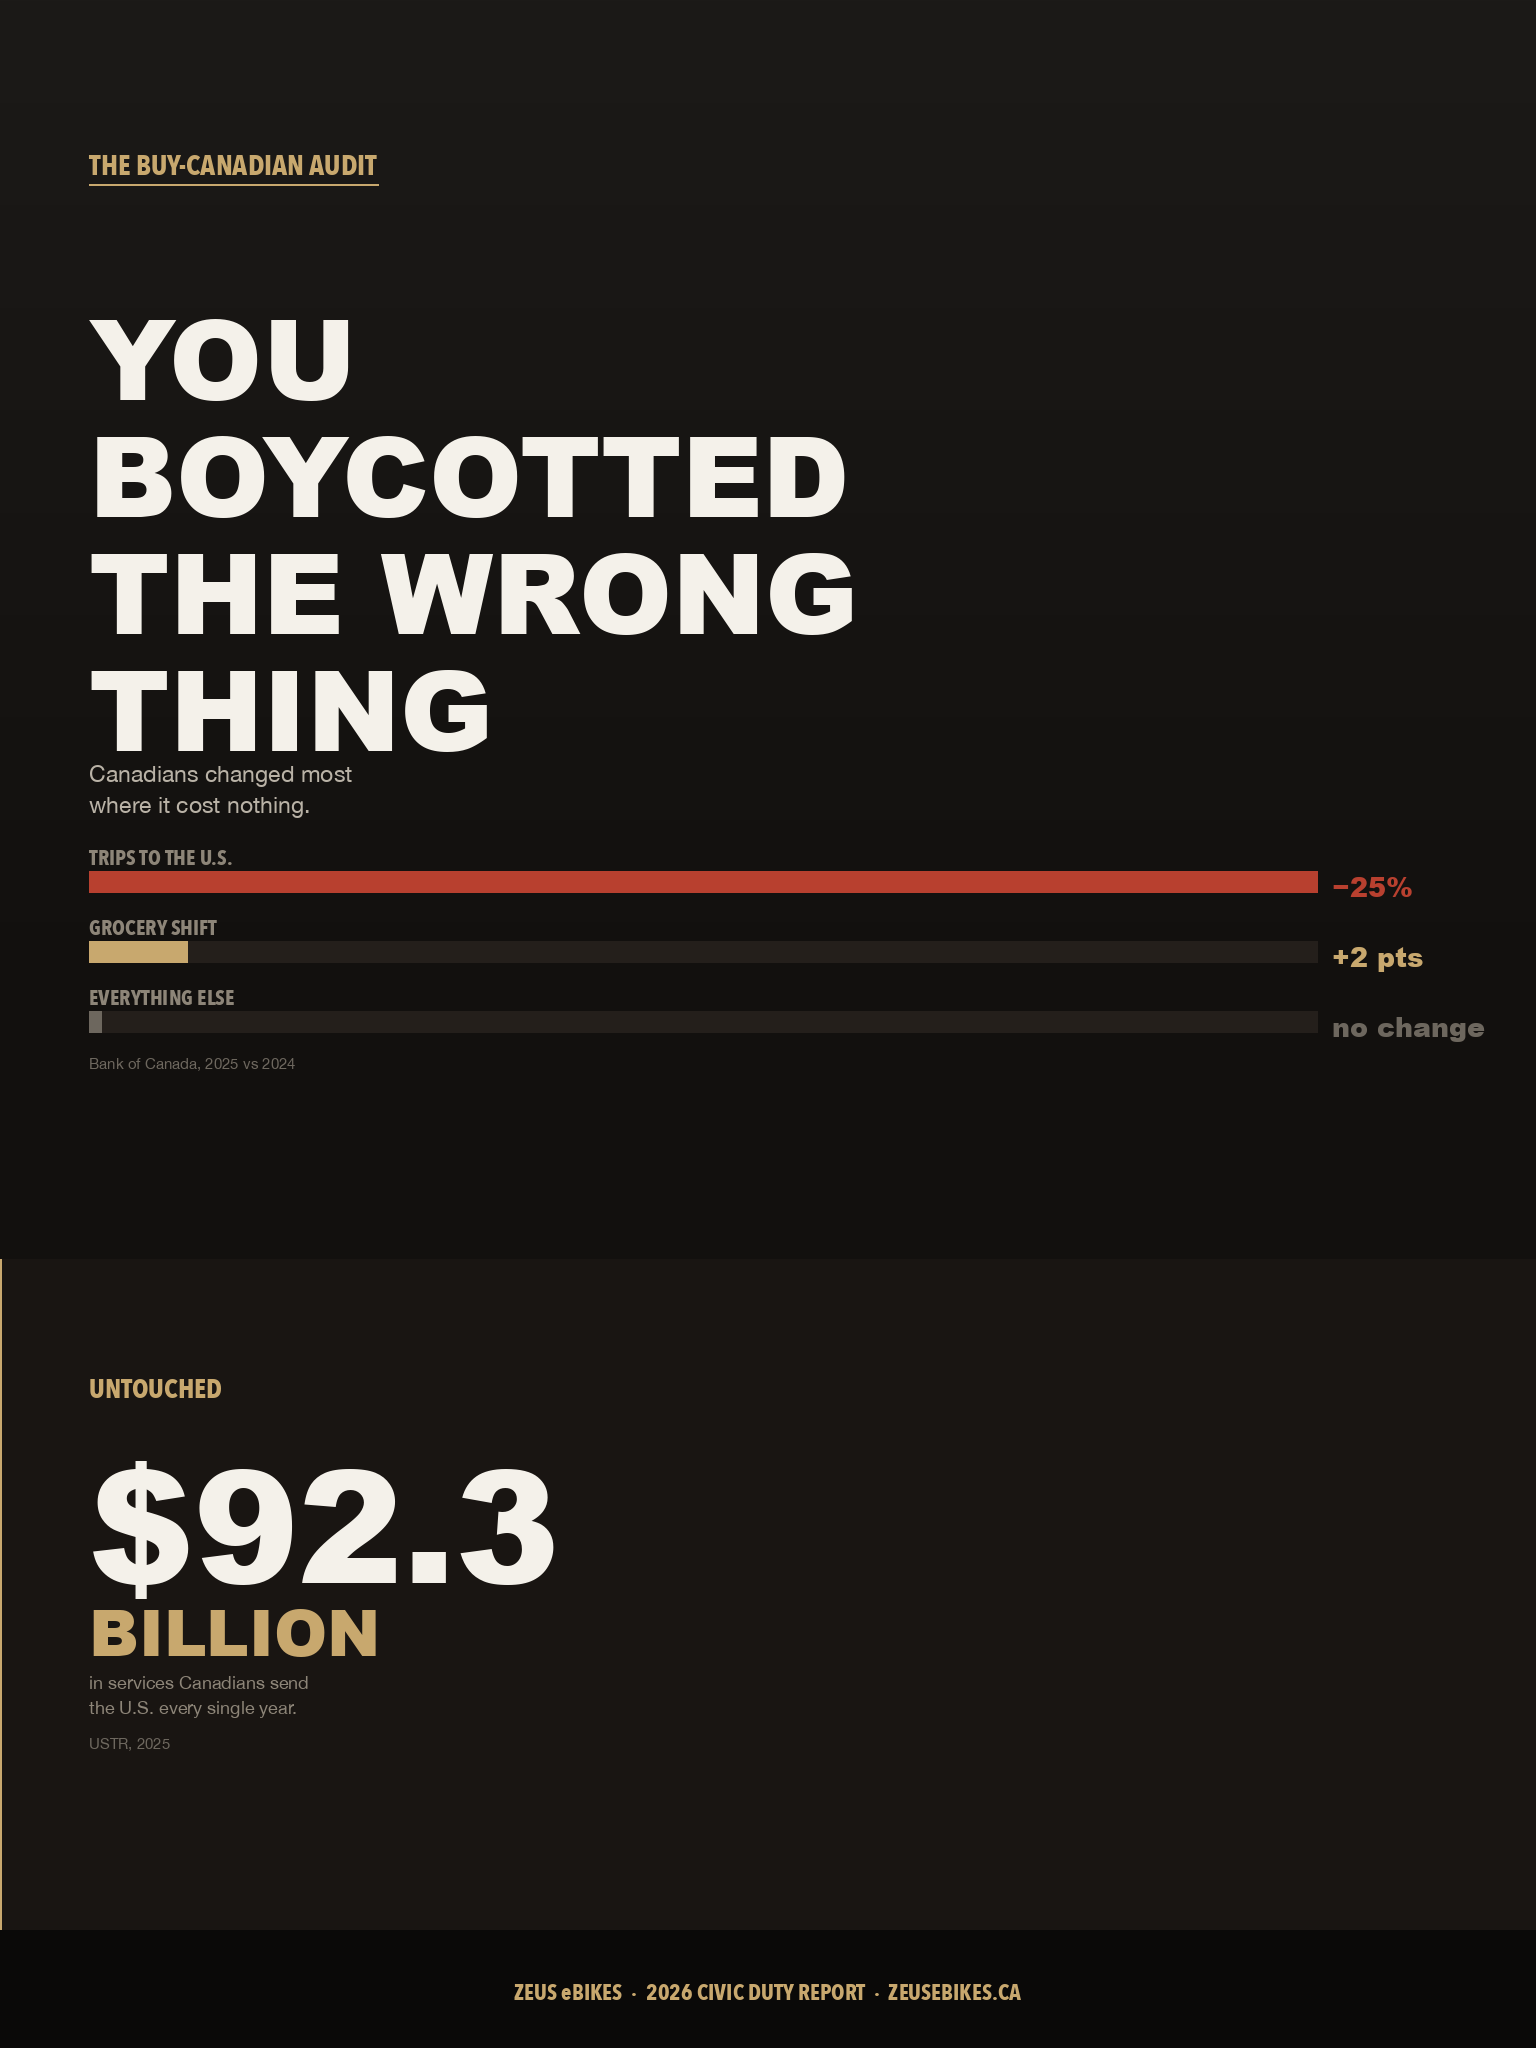
Quick answer: Buying Canadian works, but not evenly, and not where most people are aiming. The Bank of Canada found Canadians cut trips to the United States by 25% (about 10 million fewer trips) in 2025, shifted grocery spending by only about 2 percentage points, and showed "no comparable shift" outside groceries. The pattern is consistent: Canadians act decisively when the action is free and a substitute exists, and barely at all when it costs money. Meanwhile the largest untouched lever is services. Canadians send the US $92.3 billion a year, generating a $27.7 billion American surplus that cancels 57% of the goods deficit so often cited in the argument (the tariffs themselves were imposed under emergency powers citing the border, not the deficit).
How we did this. We did not rely on anyone's brand list. We downloaded the United States' own customs file — State Exports HS6 (Origin of Movement), 1,309,098 records — and parsed it ourselves. Summing every Canada-bound row returns $333,619,712,376, matching the figure the US Trade Representative publishes to within 0.0%. Product names come from the official Schedule B code list (99.89% of 97,761 lines matched). Trade balances come from USTR. Consumer-behaviour data comes from the Bank of Canada. Labelling rules come from the Competition Bureau. The questions this article answers were drawn from what Canadians are actually searching, not from what we assumed they wanted to know. Our method is described in full below, and the parser is printed in full further down this page so anyone can reproduce every number. Where our own method broke, we say so — twice, in public, in this article.
What a heart attack in Nelson, B.C. has to do with a trade war
In August 2026, a man named Ben called us from Nelson, British Columbia. He had had a heart attack. His licence was suspended for three months, his job is twenty minutes away, and an electric bike had become the difference between working and not working.
He had ordered one on Amazon. Two hours later he found a Canadian retailer, and he cancelled the Amazon order on principle — a cancellation that took him two days, a seller who offered him an off-platform side deal, and a phone call to demand his own money back.
The Canadian option cost about $225 more. Ben works twenty hours a week. In his words, on the record: "I only work twenty hours a week, and I'm grateful for that job because it's not easy to find work in a small mountain town."
He works at a 32-year-old independent store that survives on local vendors and fair trade. He is exactly the person the "buy Canadian" instruction was written for. And it cost him $225 he did not have.
Then he told us where his wages come from. Ben's paycheque comes from American tourists. Half his store's summer customers cross the border from Washington State, and when we asked whether the trade war had changed that, he said: "Not really."
He boycotts American commerce with his own wallet while his wages are paid out of American wallets — and Americans kept coming: Statistics Canada records the collapse running one way only. Call that hypocrisy and you have explained nothing. It is what a trade war looks like from inside a small mountain town, and it is why the standard advice fails the people it is aimed at.
The question this article answers: not whether to buy Canadian, but which actions actually move anything — measured against government data instead of good intentions.
What this article covers
- What Canadians actually did — the Bank of Canada numbers
- Who wrote the "buy Canadian" instruction
- How to tell if a product is actually Canadian
- The half of the trade war nobody is boycotting
- Why Ottawa cannot do this for you
- What we found in the American customs file
- The map: which state, and who represents them
- Our own books
- The services map: which app, which state, which senators
- What actually works, ranked
- Why the pattern is not a surprise
- What this article cannot tell you
- Corrections
- Sources
- Frequently asked questions
🇨🇦 The free field guide. No email, no signup. We turned this research into a printable card you can take into a store: 35 everyday products, the US state that supplies each one, and that state's two senators. Bourbon is Kentucky: McConnell and Paul. Live lobster is 90% Maine: Collins and King. Diapers are Wisconsin: Baldwin and Johnson.
Open the Buy Canadian Field Guide → · Free to print, copy and share. The full tables are also further down this page.
What Canadians actually did — measured by the Bank of Canada
In February 2026 the Bank of Canada published Assessing the Buy Canadian movement one year later, by economists Olga Bilyk and Jacob Dolinar. They used border-crossing counts and the NielsenIQ Homescan panel — roughly 10,000 households a month, barcode-level. It is the most rigorous look at what Canadians actually did, and the results are lopsided.
Ten million fewer trips. A 25% collapse, and 30% on land crossings. That is one of the largest voluntary consumer shifts in recent Canadian history, and Canadians did it without being asked twice.
Then look at groceries: two percentage points — and that is the share of food spending specifically. The Bank’s authors add a caution that matters. The biggest movements were in coffee and fruit juices, and they note the shift could also reflect Canada’s own counter-tariffs, which raised prices on some US food products and may have prompted shoppers to look for cheaper alternatives. Orange juice is the example they give. They do not claim to have separated price response from patriotism, and neither do we.
Outside groceries, in the Bank's own words: "we see no comparable shift in spending patterns." They attribute it to a shortage of Canadian alternatives.
The pattern has three tiers. Canadians moved decisively when the action was free, immediate, and required no substitute: simply not going. They moved marginally when it required paying more. They did not move at all when no alternative existed. Rank those three tiers by what each one costs the person doing it and they come out in exactly that order. Will has nothing to do with it.
Who wrote the instruction — and why it said "shop"
Nobody in Ottawa wrote the version of the instruction that Canadians actually followed. The grocery chains did, because they were the only participants with a national advertising budget and shelf space to print it on.
When "buy Canadian" surged, the grocery chains put maple leaves on their shelves. The CBC's framing at the time was blunt: buying Canadian was a matter of pride for shoppers, and for the major chains, an opportunity.
Then the labels started appearing on things that were not Canadian. Between November 2024 and February 2026 the Canadian Food Inspection Agency recorded 78 country-of-origin violations across all Canadian retail — not by any one chain. In January 2026, two Loblaw-owned stores were fined $10,000 each. One case involved American-made President's Choice broccoli slaw carrying maple-leaf decals and a "Product of Canada" shelf tag.
Then the labels came down. Loblaw stripped country-of-origin information from produce signage; Sobeys dropped the maple leaf symbol.
Then, on 26 August 2026, Loblaw CEO Per Bank announced on LinkedIn that the company would reintroduce country-of-origin labels in its produce aisles and bring back the “T” symbol marking tariff-affected items. The maple leaf symbol, which Loblaw had continued to use throughout, stays. He wrote that “Loblaw will not benefit from tariffs. Where tariffs increase our cost, any resulting increase on our shelves will reflect that impact — penny for penny.” Sobeys said it would add provincial-flag signage; Metro said it already prioritises Canadian products.
Two corrections we owe the record. It was Sobeys, not Loblaw, that dropped the maple leaf symbol in stores, and the CFIA subsequently investigated advertising practices overseen by Sobeys’ head office and closed the file without fines after the company took corrective action. Metro has no recorded violation in any of this and appears here only because it was asked to comment.
We are not calling anyone evil. Grocery retail genuinely runs on thin margins — the Competition Bureau's Retail Grocery Market Study calls it “a low-margin business” and found gross margins rose only one to two points since 2017. (An earlier version of this article attributed a “2–5%, lowest of any consumer-facing industry” figure to that report; it is not in the report and we have removed it.) We took the wider cost picture apart in why Canada is so expensive. That is a real constraint.
But shelf labelling costs almost nothing, and the labels tracked the marketing weather: up when the movement sold, misapplied 78 recorded times, down when enforcement started, back up when the political pressure returned. Our view: that reads as a campaign rather than a commitment. We looked at how the retaliation itself was walked back in why Canada dropped its retaliatory tariffs.
So the "buy Canadian" instruction was shaped by the only participants who could afford to broadcast it, and every one of them sells things. No retailer will ever run a campaign that tells you to spend less. So patriotism got translated into shopping, which is the single form of economic action that costs ordinary people money they may not have.
Reading this on your phone at the grocery store? The one action that outranks everything on this page takes ninety seconds and does not involve a shelf. Skip to what actually works, ranked.
How to tell if a product is actually Canadian
The most common question Canadians ask on this subject is some version of "how do I know if this is Canadian?" The answer is a legal definition, and it is stricter than most people assume.
The Competition Bureau's guidance (last updated 14 June 2026) sets two different bars:
| Claim on the label | What it legally requires |
|---|---|
| "Product of Canada" | At least 98% of total direct production costs incurred in Canada, and the last substantial transformation happened in Canada. |
| "Made in Canada" | At least 51% of total direct costs, and last substantial transformation in Canada, and a qualifying statement — e.g. "Made in Canada with imported parts." |
So "Made in Canada" can legally mean 49% imported. That is not a loophole; it is the published rule, and the qualifying statement is there precisely so you can see it. The Bureau's guidance covers non-food goods — food labelling falls to the Canadian Food Inspection Agency.
Knowing the rule still does not tell you where a package came from. We spent a day trying to close that gap with meat labels, on the theory that imported meat carries the exporting country’s inspection mark and American marks usually contain a plant number that maps to a state. It does not work, and we are reporting that rather than shipping it. A full-text search of the Safe Food for Canadians Regulations returns no requirement for a foreign establishment number on a Canadian label; Canada requires “Product of [country]” and the foreign inspection mark. And CFIA permits only one mark on immediate packaging — from the last plant that processed it — so American meat cut or repacked in Canada carries a Canadian number instead. The decoder only works on US product imported already retail-ready and sold untouched, which is not most of what is in the case.
The services half — what Canadians actually did to it
Canadians sent the United States $92.3 billion in services in 2025. That flow produced a $27.7 billion American surplus, which offsets 57% of the $48.3 billion goods deficit. Services are the half of the trade relationship almost no boycott advice mentions. They are also the half where Canadians landed their single hardest blow without anyone calling it a boycott.
Two things fall out of that chart, and both cut against the easy story.
First: the biggest single line is not digital at all. Other business services, which covers management consulting, legal work, engineering, and advertising and related services, is 28.8% of the total. No consumer can cancel any of it. The categories a household subscription actually lands in, telecommunications/computer/information services plus intellectual-property charges, come to about $18.2 billion. Real money. Not $92.3 billion.
Second: Canadians already ran the largest services boycott available to them, and it worked. Travel is a service. It is 19.8% of that total, and in 2025 it fell $3.4 billion — down 15.6%, the steepest decline of any category in the account. Air passenger fares fell another 10.6%. Ten million fewer trips showed up in the American national accounts exactly where you would expect.
And US services exports to Canada still went up. $90.6 billion to $92.3 billion, a 1.9% increase. Other business services grew $2.8 billion, covering 82% of the travel loss on their own, and the remaining categories made up the difference. Canadians pulled the biggest lever they had, pulled it hard, and the categories they cannot reach grew faster than the one they could.
That is not an argument for giving up. It is an argument for knowing which lever is which.
| Boycotting goods | Cancelling a service | |
|---|---|---|
| Can you identify it? | Rarely — the label says “Product of USA,” never which state | Perfectly. You know exactly what you subscribe to |
| Share of the dollar leaving Canada | Small — most of a shelf price is Canadian retail, wages and rent | Close to all of it |
| How often? | Once per purchase | Every month, indefinitely |
| Does the company notice? | It appears in no filing anywhere | Yes — subscriber and per-user revenue are reported to shareholders |
| What it costs you | You pay more | You save money |
The advice runs backwards, then. Boycotting groceries costs a shopper the most and moves the least; cancelling an unused subscription pays them back and moves close to the whole dollar. That survives the correction above. It now rests on $18.2 billion of reachable services rather than on a $92.3 billion total that is mostly corporate consulting and travel.
Why Ottawa cannot do this for you
Twice, Canada tried to make American technology companies pay, and twice it stopped under trade pressure.
The Digital Services Tax, a 3% levy whose named targets included Amazon, Google and Meta, was rescinded on 29 June 2025, hours before the first payments were due, two days after the President suspended trade negotiations over it. Forgone revenue: roughly $7.2 billion over five years.
Then, in a 17 July 2026 filing to the Federal Court of Appeal, Canada confirmed it will eliminate the base contribution requirement on foreign streaming services and replace it with government funding — meaning the Canadian taxpayer now pays for Canadian content instead of the streamers.
And the government's own Buy Canadian procurement policy is legally boxed in. Noah Fry, a Killam postdoctoral fellow at Dalhousie who studies public procurement, found that under the $25 million threshold only six contracts out of roughly 56,000 annually were not already going to Canadian suppliers — narrowing to two once you isolate genuinely competitive bids. Trade agreements forbid most origin discrimination. We traced the wider dependency in what happens if America stops being Canada's friend.
Ottawa is bound by treaty. You are not bound by anything. The only actor in this economy with unrestricted freedom to choose is the individual. That individual got the weakest instructions of anyone.
What we found in the American customs file
Rather than trust anyone's list, we downloaded the United States' own export record , every state, every product, every destination, and parsed 1,309,098 lines. Four things fell out of it, and three of them undercut the advice Canadians are being given.
1. A tenth of the trade cannot be traced to any state
$38.85 billion, 11.6% of everything the US exported to Canada in 2025, carries the state code "XX" and is attributable to no state at all. Every state-level analysis of this trade, including the ones cited by legislators, is working with a denominator missing more than a tenth of the total.
2. The data credits farm exports to the wrong states
The series records the state a shipment moved from, not where the goods were grown or made. For bulk crops railed to export terminals, that produces results that look absurd once you check them against production:
| Commodity | US total, 2025 | Credited to | Reality |
|---|---|---|---|
| Soybeans | $16.20B | Louisiana 53% | Louisiana grew 0.97% of US soybeans in 2025. Illinois (15.0%) and Iowa (14.0%) lead production. |
| Corn | $18.67B | Louisiana 41%, Washington 27% | Iowa, the largest corn state, is credited with 7%. |
| Durum wheat | $0.18B | Texas 53% | North Dakota, the dominant durum producer, is credited with essentially nothing. |
The distortion is not universal, and the exceptions prove the mechanism. Apples: Washington is credited with 77% and grows roughly 60–67% — close. Canola: North Dakota is credited with 66% and grows 81–83% — close, and slightly under. Both are goods that ship direct rather than transiting a distant port.
For a Canadian reading this, the Canada-bound half of the data is the reliable half. Goods crossing the land border by truck, rail or pipeline are attributed to their true origin state. It is the "exports to the rest of the world" denominator that breaks. We published our own retraction of an earlier ranking that relied on it.
3. Some "American" food is not American
$517.9 million of bananas were exported from the United States to Canada in 2025, credited to California, New Jersey and Delaware. The United States grows essentially no commercial bananas — it imports about 9.2 billion pounds a year, against a Hawaii crop of 4.7 million pounds. Delaware is a fruit port, not a plantation.
The same applies to $428 million of prepared nuts (cashews, almonds, pistachios and Brazil nuts — several of which are not grown in the US at all) and much of $466 million of roasted coffee (the roasting is American value-add; the bean is not).
Declining "American" bananas therefore transfers pressure to a logistics chain while the grower remains Ecuadorian or Guatemalan. A meaningful slice of avoid-American-produce advice is aimed at the wrong target.
4. Consumer pressure works on some states and not others
Across all 50 states there are 97,761 distinct product lines flowing to Canada. Classifying them by whether an individual could plausibly decline them at retail produces a spread most people would not expect:
Michigan sells Canada $23.25 billion and only about 6% of it is anything a person could choose not to buy. The rest is automotive components and industrial goods. New Jersey's figure is seven times higher. A consumer boycott aimed at one delegation is close to symbolic; aimed at another it touches four dollars in ten.
A caveat we are publishing against ourselves. Our first pass at this classification was wrong at the top. Sorting by tariff chapter put gold bullion ($2.55B), gold scrap ($2.29B) and denatured fuel ethanol ($1.66B) at the head of several state lists as "consumer goods." Nobody buys fuel ethanol at a till. Any list built without a human filter would have handed readers gold scrap as a boycott target. We caught it, and we are telling you rather than quietly fixing it, because a method you cannot inspect is not a method.
Want the receipts? Every figure here traces to a government source, and the parser is printed in full below so you can run it yourself. See what we found in the customs file and the source list at the end.
The map: which state absorbs it, and who represents them
No grocery chain is going to print this table. Using the American customs file we can say, for any everyday product, which state ships the most of it to Canada, and from the current Congressional roster, exactly who represents that state in the Senate.
Two weightings matter, and they answer different questions. Share of US supply tells you who absorbs it if you decline: of everything America ships Canada in that product, how much leaves from that one state. The second, in our published data files, is what share of that state's total Canada-bound trade the product represents, which is how much the state actually depends on it.
Senators are listed because they represent the state. They are not listed because they set tariff policy, and not because they have any role in these products. This is a map of where economic weight sits and who speaks for it in Washington. Nothing more. Roster current as of August 2026; several seats change hands in November 2026 and January 2027.
These are also supply concentrations, not brand accusations. A high share means that state is where most of America's exports of that product to Canada originate. It does not mean any particular brand on a Canadian shelf came from there — country-of-origin labelling tells you the country, not the state. Use this to understand where economic weight sits, not to accuse a company.
Food & drink
| If you decline this | State | Share of US supply | Its two senators |
|---|---|---|---|
| Live lobster | ME | 90% | Susan M. Collins (R); Angus S. King, Jr. (I) |
| Fresh boneless beef and bison | CO | 43% | Michael F. Bennet (D); John W. Hickenlooper (D) |
| Fresh chicken and chicken offal | GA | 24% | Jon Ossoff (D); Raphael G. Warnock (D) |
| Processed pork (fresh/chilled) | CO | 34% | Michael F. Bennet (D); John W. Hickenlooper (D) |
| Sausages and similar products | WI | 27% | Tammy Baldwin (D); Ron Johnson (R) |
| Fresh strawberries | CA | 70% | Adam B. Schiff (D); Alex Padilla (D) |
| Fresh grapes | CA | 65% | Adam B. Schiff (D); Alex Padilla (D) |
| Fresh raspberries, blackberries and similar berries | CA | 52% | Adam B. Schiff (D); Alex Padilla (D) |
| Fresh apples | WA | 74% | Maria Cantwell (D); Patty Murray (D) |
| Fresh tomatoes | TX | 27% | John Cornyn (R); Ted Cruz (R) |
| Fresh peppers | AZ | 27% | Ruben Gallego (D); Mark Kelly (D) |
| Packaged cut salad mixes | CA | 39% | Adam B. Schiff (D); Alex Padilla (D) |
| Baked goods — pastry, cake, biscuits, puddings | IL | 12% | Richard J. Durbin (D); Tammy Duckworth (D) |
| Puffed and roasted cereal products | MI | 13% | Gary C. Peters (D); Elissa Slotkin (D) |
| Mayonnaise, salad dressings, condiments and sauces | CA | 16% | Adam B. Schiff (D); Alex Padilla (D) |
| Peanut butter and prepared peanuts | NC | 38% | Thom Tillis (R); Ted Budd (R) |
| Dried soups, broths and preparations | OH | 42% | Bernie Moreno (R); Jon Husted (R) |
| Sugar confectionery without cocoa | IL | 17% | Richard J. Durbin (D); Tammy Duckworth (D) |
| Chocolate and cocoa preparations | PA | 34% | John Fetterman (D); David McCormick (R) |
| Carbonated soft drinks and mineral water | AZ | 28% | Ruben Gallego (D); Mark Kelly (D) |
| Non-alcoholic drinks — milk-based and fortified juices | OH | 17% | Bernie Moreno (R); Jon Husted (R) |
| Whisky — all types, including bourbon and rye | KY | 59% | Mitch McConnell (R); Rand Paul (R) |
| Mixes and doughs for cookies, waffles and wafers | TN | 18% | Marsha Blackburn (R); Bill Hagerty (R) |
| Prepared nuts — cashews, almonds, pistachios, Brazil nuts and mixes | CA | 41% | Adam B. Schiff (D); Alex Padilla (D) |
Household & personal
| If you decline this | State | Share of US supply | Its two senators |
|---|---|---|---|
| Diapers, sanitary pads, tampons and liners | WI | 33% | Tammy Baldwin (D); Ron Johnson (R) |
| Liquid and cream soap for skin, retail | OH | 16% | Bernie Moreno (R); Jon Husted (R) |
| Bar soap for toilet use | IN | 34% | Todd Young (R); Jim Banks (R) |
| Shampoo | WV | 15% | Shelley Moore Capito (R); James C. Justice (R) |
| Hair preparations | CA | 12% | Adam B. Schiff (D); Alex Padilla (D) |
| Perfume and toilet water | NY | 25% | Kirsten E. Gillibrand (D); Charles E. Schumer (D) |
| Detergents, washing and cleaning preparations | IL | 14% | Richard J. Durbin (D); Tammy Duckworth (D) |
| Toothbrushes | IA | 42% | Chuck Grassley (R); Joni Ernst (R) |
| Metal furniture, household and counters | IL | 7% | Richard J. Durbin (D); Tammy Duckworth (D) |
| Wooden furniture | CA | 4% | Adam B. Schiff (D); Alex Padilla (D) |
| LED chandeliers and ceiling/wall lights | CA | 17% | Adam B. Schiff (D); Alex Padilla (D) |
| Wheeled toys, dolls, scale models and other toys | TX | 26% | John Cornyn (R); Ted Cruz (R) |
What this changes is that Ben in Nelson does not have to trust a grocery chain's shelf tag to know where economic weight sits. The customs record is public, the roster is public, and now the join between them is public too.
The script, so you can check us
This is the parser we ran against the US Census file. Download STHS6M2512.ZIP from the Census State Exports HS6 page, unzip it, and run this against STHS6R2512.txt. It should print $333,619,712,376. If it does not, we are wrong and we want to know.
#!/usr/bin/env python3
"""
Parse US Census "State Exports HS6 (Origin of Movement)" fixed-width customs files.

PROVENANCE
  Source : https://www.census.gov/trade/downloads/2025/state_exp/hs6_om_m/STHS6M2512.ZIP
           (listed on https://www.census.gov/foreign-trade/data/STHS6M.html)
  File   : STHS6R2512.txt  — Dec 2025 monthly file; YTD columns = full calendar year 2025
  Pulled : 2026-08-27
  Rows   : 1,309,098

RECORD LAYOUT (inferred from the file, then VALIDATED against an independent published total —
see validate() below). Fixed width:
    [0:6]   HS6 commodity code
    [6:10]  Country code (Canada = 1220)
    [10:12] State of origin-of-movement (USPS 2-char)
    [12:18] YYYYMM
    then 14 right-aligned numeric fields, width 15 each:
      1-7  monthly : ALL_VAL_MO, AIR_VAL_MO, AIR_WGT_MO, VES_VAL_MO, VES_WGT_MO, CNT_VAL_MO, CNT_WGT_MO
      8-14 YTD     : ALL_VAL_YR, AIR_VAL_YR, AIR_WGT_YR, VES_VAL_YR, VES_WGT_YR, CNT_VAL_YR, CNT_WGT_YR
    -> ALL_VAL_YR (field 8) is the calendar-year total value in USD.

Values are nominal USD, origin-of-movement basis (the state the goods were shipped FROM, which is
not necessarily where they were produced — a known limitation of this series, state it in print).
"""
import sys, collections

CANADA = "1220"
VAL_START, W = 18, 15

def rows(path, country=None):
    with open(path, "r", errors="replace") as fh:
        for line in fh:
            if len(line) < VAL_START + W * 14:
                continue
            cty = line[6:10]
            if country and cty != country:
                continue
            vals = [line[VAL_START + i*W : VAL_START + (i+1)*W].strip() for i in range(14)]
            try:
                all_val_yr = int(vals[7] or 0)
            except ValueError:
                continue
            yield {"hs6": line[0:6], "cty": cty, "state": line[10:12],
                   "time": line[12:18], "all_val_yr": all_val_yr}

def validate(path):
    """Sum ALL_VAL_YR for Canada across all states and compare to USTR's published
    US goods exports to Canada 2025 = $333.6 billion. A match confirms the layout."""
    total = 0; n = 0; states = collections.Counter()
    for r in rows(path, CANADA):
        total += r["all_val_yr"]; n += 1; states[r["state"]] += r["all_val_yr"]
    print(f"Canada rows            : {n:,}")
    print(f"Sum ALL_VAL_YR (Canada): ${total:,}  = ${total/1e9:,.1f} B")
    print(f"USTR published 2025    : $333.6 B  -> delta {(total/1e9-333.6)/333.6*100:+.1f}%")
    print(f"Distinct state codes   : {len(states)}")
    return states

if __name__ == "__main__":
    validate(sys.argv[1])

# ---------------------------------------------------------------------------
def dependence_and_concentration(path):
    """For every state: exports to Canada, exports to the WORLD, Canada's share,
    and how concentrated the Canada-bound basket is (top-1 and top-3 HS6 share).
    Concentration is Milad's apple test: a state carried by one product has no shock absorber."""
    to_can   = collections.Counter()
    to_world = collections.Counter()
    prod     = collections.defaultdict(collections.Counter)   # state -> hs6 -> $ to Canada
    for r in rows(path):
        st, v = r["state"], r["all_val_yr"]
        to_world[st] += v
        if r["cty"] == CANADA:
            to_can[st] += v
            prod[st][r["hs6"]] += v
    out = []
    for st, can in to_can.items():
        world = to_world[st]
        top = prod[st].most_common(3)
        t1 = top[0][1]/can*100 if can and top else 0
        t3 = sum(v for _, v in top)/can*100 if can else 0
        out.append({"state": st, "to_canada": can, "to_world": world,
                    "canada_share": can/world*100 if world else 0,
                    "top1_share": t1, "top3_share": t3,
                    "top": top})
    return out
Our own books, since we are asking you to inspect everyone else's
An article arguing that the "buy Canadian" instruction was written by people who sell things is worthless unless the people writing it disclose that they sell things too. We sell things. Here is the ledger.
Zeus is a retailer, and we charge a premium over the cheapest way to buy the same product. That premium pays for a Canadian business staying in the transaction: the phone that gets answered, the warranty someone actually processes, the hour we spent on the call that produced this article. When Ben asked whether we would close the $225 gap between us and a cheaper option, we said no. He is choosing a dealer closer to home, partly because we told him to. You should weigh that premium against what this article ranks it as: fifth of five, the costliest action with the smallest national effect.
None of our bikes are made in Canada. Neither are almost anyone's. We wrote a separate, honest accounting of that in our guide to Canadian-made electric bikes, including which brands assemble here and which merely say so.
We could not follow our own advice completely, but we did move what we could. Our store runs on Shopify, an Ottawa company. And the single biggest line item we actually switched was video and image production.
Every photograph, cover and video Zeus publishes used to run through American creative tooling. It now runs through Playcut, built by Blox Labs Inc. — a Canadian-headquartered team, Toronto-registered with roots in London, Ontario. For a small retailer, creative production is one of the few recurring software costs large enough to matter, and it is one of the rare categories where a genuinely Canadian option exists at the same quality. It let us build a consistent visual identity across hundreds of articles without a studio, a crew, or a monthly cheque leaving the country. If you run a Canadian business and you are looking for the switch that is actually available rather than theoretically available, that is ours, and we would make it again.
Search, social, communications and analytics all still run on American platforms, and we looked hard at each one. In those categories there was either no Canadian equivalent at all, or none we could move to without breaking the business, which is exactly the dependency this article is about.
We could not leave them either, which is the point rather than the excuse. These services are difficult to leave, which is exactly why Ottawa could not tax them and why the only remaining leverage sits with the individual subscriber.
The services map: which app, which state, which senators
The state map above is for groceries, which this article ranks fourth. This is the same map for the action ranked first, and it is far more usable, because you do not need a label to tell you what you subscribe to. You already know.
Sixteen American services, where each company is headquartered, who represents that state, and what is on the public record about that company and the current administration.
Start with the free ones. They cost you nothing to leave. Some rows below take money from you every month. Others take none at all: Facebook, Instagram, WhatsApp, Threads, Google Search, YouTube, Gmail and X are free to you because you are what is being sold to advertisers. That makes them the easiest thing on this page to walk away from. No cancellation to fight, no refund to chase, nothing to unwind. You just stop. And because advertising revenue per user is reported to shareholders every quarter, it is one of the few consumer decisions a company actually counts.
| What you pay for | Company | Headquarters | That state's senators | On the public record |
|---|---|---|---|---|
| Netflix | Netflix | Los Gatos, CA | Adam B. Schiff (D); Alex Padilla (D) | No documented relationship on the record |
| Prime Video · Prime · Audible · AWS | Amazon | Seattle, WA | Maria Cantwell (D); Patty Murray (D) | $1,888,893.52 to the inauguration committee — $1,000,000 cash plus $888,893.52 disclosed as in-kind digital services and advertising (the Prime stream). Bezos on the inauguration platform. |
| Disney+ · Hulu · ESPN+ | The Walt Disney Company | Burbank, CA | Adam B. Schiff (D); Alex Padilla (D) | No documented relationship on the record |
| Apple TV+ · Apple Music · iCloud · App Store | Apple | Cupertino, CA | Adam B. Schiff (D); Alex Padilla (D) | Apple itself gave nothing. CEO Tim Cook gave $1,000,000 personally (Trump-Vance Inaugural Committee, FEC C00894162, 3 Jan 2025). Apple the company gave $43,200 in in-kind event supplies to the 2021 inauguration. |
| Microsoft 365 · Xbox · LinkedIn · OneDrive | Microsoft | Redmond, WA | Maria Cantwell (D); Patty Murray (D) | $750,000 disclosed to the inauguration committee (FEC filing C00894162). Microsoft announced $1M; $750,000 was ever disclosed. |
| Facebook · Instagram · WhatsApp · Threads | Meta Platforms | Menlo Park, CA | Adam B. Schiff (D); Alex Padilla (D) | $1,000,000 to the inauguration committee — its first ever presidential inauguration donation (FEC C00894162); Zuckerberg on the platform. |
| Google · YouTube · YouTube Premium · Gmail | Alphabet | Mountain View, CA | Adam B. Schiff (D); Alex Padilla (D) | $1,000,000 to the inauguration committee; Pichai on the inauguration platform. |
| ChatGPT | OpenAI | San Francisco, CA | Adam B. Schiff (D); Alex Padilla (D) | OpenAI itself gave nothing. Sam Altman gave $1,000,000 personally (FEC filing C00894162). |
| Adobe Creative Cloud | Adobe | San Jose, CA | Adam B. Schiff (D); Alex Padilla (D) | $1,000,000 to the inauguration committee (FEC C00894162). |
| Uber · Uber Eats | Uber Technologies | San Francisco, CA | Adam B. Schiff (D); Alex Padilla (D) | $2,000,000 total — $1,000,000 from Uber and $1,000,000 personally from CEO Dara Khosrowshahi, same day (FEC filing C00894162). |
| DoorDash | DoorDash | San Francisco, CA | Adam B. Schiff (D); Alex Padilla (D) | $100,000 to the inauguration committee, 15 Jan 2025 (FEC filing C00894162). |
| TikTok | TikTok USDS Joint Venture LLC | Culver City, CA | Adam B. Schiff (D); Alex Padilla (D) | US operations divested 22 January 2026 under Executive Order 14352. Oracle, Silver Lake and MGX hold 15% each; ByteDance retains 19.9%. Oracle hosts US user data and the recommendation algorithm as Trusted Security Partner. |
| X (formerly Twitter) | SpaceX (X platform) | Starbase, TX | John Cornyn (R); Ted Cruz (R) | $1,000,000 in in-kind advertising to the inauguration committee, 15 Jan 2025 (FEC filing C00894162). xAI merged into SpaceX on 2 February 2026, so the X platform now sits inside SpaceX’s AI segment. Musk co-led the DOGE cost-cutting effort, then publicly fell out with the President. |
| HBO Max · Warner Bros. films | Warner Bros. Discovery | New York, NY | Kirsten E. Gillibrand (D); Charles E. Schumer (D) | No documented relationship on the record |
| Peacock · NBC | NBCUniversal | New York, NY | Kirsten E. Gillibrand (D); Charles E. Schumer (D) | Parent company Comcast gave $1,000,000 to the inauguration committee, 13 Dec 2024 (FEC filing C00894162). Comcast is based in Philadelphia, PA. |
| Paramount+ · Paramount films | Paramount Skydance | New York, NY | Kirsten E. Gillibrand (D); Charles E. Schumer (D) | No documented relationship on the record. Reported in Aug 2026 to be considering relocating its headquarters. |
| The Roku Channel | Roku | San Jose, CA | Adam B. Schiff (D); Alex Padilla (D) | No documented relationship on the record |
Look at where the head offices cluster. Ten of those seventeen companies are headquartered in California. Three in New York, two in Washington, one in Texas. Nearly the entire recurring services bill a Canadian household pays lands in four state delegations — and unlike a grocery shelf, there is no labelling problem here at all. Your subscription list already names them.
Three services people get wrong
| Service | Actually based in | What that means |
|---|---|---|
| Spotify | Stockholm (Luxembourg-incorporated) | Cancelling it does not touch the United States. |
| SkipTheDishes | South African control, via Amsterdam | Winnipeg-founded, sold to Britain's Just Eat, merged into Amsterdam-listed Just Eat Takeaway, and acquired outright by Prosus N.V. in 2025 — which is itself about 73% owned by Naspers, a South African company. |
| DuckDuckGo | United States (Paoli, PA) | The privacy alternative IS American — senators: John Fetterman (D); David McCormick (R) |
There is a complication here we are not going to hide. California, Washington and New York are not the delegations driving the tariffs. Cancelling subscriptions applies pressure to a different political map than boycotting goods does, and pretending the two line up would be dishonest. Services pressure is economic: it moves a national trade balance. Goods pressure is political: it is a message to a specific delegation. They are different instruments and they are not aimed at the same target.
What actually works, ranked
Every row is ordered against the Bank of Canada’s behavioural findings and the USTR trade balances, on four measurable factors: how much of the dollar leaves Canada, whether it recurs, whether the company reports the loss to shareholders, and what it costs you.
| # | Action | What it costs you | Why it ranks here |
|---|---|---|---|
| 1 | Cancel an American subscription you do not use | You save money | Close to 100% of the dollar leaves Canada, it recurs monthly, and subscriber counts are reported to shareholders. Highest leverage per dollar of personal cost, by a wide margin. |
| 2 | Travel domestically instead of to the US | Neutral — you were spending it anyway | The one action Canadians already proved works: a 25% collapse, ~10 million trips, measured by the Bank of Canada. |
| 3 | Move a paid software tool to a Canadian vendor | Often nothing | Full redirection of a recurring business expense. Applies to anyone running a business. |
| 4 | Buy Canadian groceries where a real alternative exists | Sometimes more | Genuinely works, and Canadians have already moved ~2 points — but most of a shelf price is Canadian wages and rent either way, so the transferred amount per purchase is small. |
| 5 | Pay a large premium for an imported product from a Canadian retailer | The most | Ben's $225. The item is made overseas in every option; the only question is which Canadian keeps the margin. Real, but the smallest national effect for the largest personal cost. |
Before you switch, check where the money actually goes. The three commonest substitutions are all in the table above, and none of them does what people think. Leaving an American delivery app for SkipTheDishes routes the money to Amsterdam and Johannesburg. Cancelling Spotify never touches the United States. Switching search to DuckDuckGo moves you from California to Pennsylvania.
Frequently asked questions
Does buying Canadian actually work?
Partly, and unevenly. The Bank of Canada measured a 25% drop in trips to the US and roughly a 2-percentage-point shift in grocery spending, with no comparable movement in other categories. The pattern is that Canadians act when the action is free and an alternative exists.
What does “Made in Canada” legally mean?
At least 51% of total direct production costs incurred in Canada, the last substantial transformation performed in Canada, and a qualifying statement disclosing imported content. “Product of Canada” requires at least 98%. Those are Competition Bureau thresholds for non-food goods; food falls under the Canadian Food Inspection Agency.
What is the single highest-impact thing I can do?
On the evidence: cancel an American subscription you are not using. Nearly the whole dollar leaves Canada, it repeats every month, it is visible in the company’s own reporting, and it refunds you rather than costing you.
Is it worth paying more for a Canadian retailer?
Sometimes — but be clear about what you are buying. If the product is manufactured overseas either way, the premium buys a Canadian business staying in the transaction, not Canadian manufacturing. That can be worth it. It is a different thing from what most people think they are paying for.
Why doesn’t the government just require Buy Canadian?
Trade agreements largely forbid origin discrimination in procurement. Research by Noah Fry at Dalhousie found only six contracts out of roughly 56,000 annually were not already going to Canadian suppliers — two, once competitive bids are isolated.
How can I tell which US state a product came from?
For most goods you cannot — the label reads “Product of USA” and nothing more. We tried to solve this with meat labels and it does not work: a full-text search of the Safe Food for Canadians Regulations returns no requirement for a foreign establishment number on a Canadian label. Canada requires a country name and the foreign inspection mark, and only the last processor’s mark may appear on immediate packaging.
What to do on Monday
Open your phone's subscription list. Most people find one or two they forgot they were paying for. That single action outranks a month of careful label-reading at the grocery store, costs you nothing, and gives you money back.
Then, if you want the harder version: the ranked action ledger and the state-by-state product tables are already published as a free printable field guide — open it here. No email, no signup, free to copy and share.
The bottom line. Canadians were not lazy about this. They were misdirected. They executed decisively on the one action that was free and available, and were never told that the largest lever in their hands is the $92.3 billion in services they renew without thinking about it every month. Ben paid $225 he did not have for the action with the smallest national effect, because that is what he was told to do. He deserved better advice. So does everyone else.
Why the pattern is not a surprise — what four literatures already predicted
The finding in this article is that Canadians acted decisively where action was free and barely where it cost money. That is not a novel observation about Canadians. It is a national-scale instance of something four separate research literatures have documented for decades.
1. The intention–behaviour gap is measured, and it is large
Survey data on this movement is strong: Canadians report preferring domestic retailers and say they would pay more for Canadian-made goods. The Bank of Canada measured what they actually did — about two percentage points of food spending. That distance has a name and a literature.
Sheeran’s meta-analysis of ten prior meta-analyses, covering 422 studies, found intentions correlate with subsequent behaviour at r = 0.53, explaining roughly 28% of the variance in what people actually do. Put the other way, people translate stated good intentions into action about half the time, and nearly three-quarters of behavioural variance sits outside intention altogether.1
So the gap is neither hypocrisy nor a Canadian failure. A movement where stated support runs high and measured behaviour change runs low is the ordinary, predicted result. The question worth asking was never why people failed to follow through. It is which actions closed the gap and which did not.
2. Boycott participation is predicted by what it costs the boycotter
Klein, Smith and John tested boycott participation during an actual multinational boycott and identified four predictors. Three concern motivation: the desire to make a difference, the scope for self-enhancement, and counterarguments that inhibit participation. The fourth is the one that matters here: the cost to the boycotter of constrained consumption. They found it operates as a significant moderator — even where consumers judged a firm’s conduct egregious, participation fell as the personal cost of abstaining rose.2
That is precisely the pattern in the Canadian data, at a scale their study could not reach. Not travelling to the United States carries almost no constrained-consumption cost — there is a domestic substitute, and it is often cheaper. Result: a 25% collapse. Switching groceries carries a real and repeated cost. Result: two points. Categories with no Canadian substitute carry an unbounded cost. Result: no measurable movement at all.
3. Collective action theory explains why the free actions worked
A consumer boycott is a textbook public good. The benefit — leverage in a trade dispute — is diffuse and accrues to everyone regardless of participation, while the cost is private and falls on whoever participates. Olson’s central result is that under exactly these conditions large groups under-provide the good, because each member’s rational move is to free-ride, and the incentive to free-ride grows with group size. Absent a selective incentive, collective action among a large diffuse group tends to fail.3
Olson supplies the mechanism. Forty-one million Canadians are the largest, most diffuse group imaginable, so his model predicts failure, and on groceries that is what happened. But the actions that did work share a property that dissolves the free-rider problem entirely: they carry a negative private cost. Staying home instead of crossing the border saves money. Cancelling an unused subscription refunds you. When the action pays the actor, free-riding has nothing to free-ride on, and participation no longer depends on anyone else participating.
That is a testable claim, and it is the strongest reason to rank cancellation first. Subscriptions are not morally weightier than groceries. They are simply the only category where the economics of collective action stop working against the participant.
4. Who can afford to participate is a question about class
Consumer ethnocentrism — the preference for domestic goods held as a moral rather than purely economic matter — has been a measurable construct since Shimp and Sharma’s CETSCALE, validated across four studies and since translated for use in many countries.4 It is a disposition, and dispositions are distributed across a population fairly evenly.
Willingness to pay is not. A $225 premium is the same $225 to every household, but it is not the same sacrifice. For a household with disposable income it is a rounding error and a small moral pleasure. For someone working twenty hours a week in a mountain town it is a genuine loss, weighed against groceries. An instruction to express national loyalty through paying more is therefore regressive by construction: it asks for identical absolute sacrifice from unequal capacity, and it converts a civic sentiment into a good that the well-off can purchase more of.
The free actions are the only ones available to everyone. They are also, on the evidence, the ones that move the most.
One caution about all four literatures. The alignment between them and the Canadian data is consistency, not proof. We did not run an experiment, we cannot randomise who faces a high or low cost of switching, and we therefore cannot rule out that travel fell for reasons unrelated to cost: exchange rates, border friction, or political sentiment independent of price. What we can say is narrower and still worth saying: the observed pattern is what four independent research traditions would have predicted in advance, and no competing explanation we are aware of accounts for all three tiers of the result at once.
What this article cannot tell you
Every dataset above has an edge past which it stops meaning anything. Here are the edges of ours.
| Limitation | What it means for the numbers above |
|---|---|
| Origin of movement is not origin of production | The US Census series records the state a shipment left from. Census states plainly it “was not designed to measure the state distribution of US export production.” Bulk goods railed to ports are credited to the port state. Canada-bound land freight is reliable; the world-export denominator is not. |
| $38.85 billion is untraceable | 11.6% of US exports to Canada carries no state code. Every state share in this article is a share of the 88.4% that can be attributed. |
| Tariff codes group unlike goods | An HS6 code can cover several products. We rebuilt every label from the common content of all lines beneath each code, but a label like “prepared nuts” still spans cashews, almonds and pistachios. Bourbon cannot be separated from rye at this level. |
| Shares are Canada-lane specific | Maine is 90% of live lobster to Canada but roughly 49% worldwide; Kentucky is 59% of whisky to Canada and about 25% worldwide. These figures describe one trade lane and do not generalise. |
| Grocery origin is inferred from licensing | The Bank of Canada’s food-spending finding maps barcodes through the GS1 registry, which records where a product was licensed, not where it was made. The authors flag this themselves. |
| We could not decompose the services total | BEA publishes services to Canada by category, but not by consumer versus business within each category. The roughly $18.2 billion of reachable consumer services is our reading of which categories a household can actually cancel, not a published figure. |
| The senator roster decays | Current as of August 2026. Several seats change hands in November 2026 and January 2027. Check before relying on a printed copy. |
| Zeus is a retailer | We sell electric bikes. This article ranks buying an imported product from a Canadian retailer — our own business — fifth of five, the costliest action with the smallest national effect. Read it knowing that. |
Data statement
| Field | Specification |
|---|---|
| Primary dataset | US Census Bureau, State Exports HS6 (Origin of Movement), file STHS6R2512.txt, December 2025 release carrying calendar-year 2025 totals |
| Unit of observation | One record per state × six-digit HS commodity × destination country × month |
| Population | All recorded US merchandise exports, 2025. Not a sample — a census of declared shipments |
| Records | 1,309,098 total; 97,761 Canada-bound state × commodity lines |
| Jurisdictions | 54 codes: 50 states, DC, PR, VI, and XX (unallocated). Analysis excludes non-states where noted |
| Validation | Sum of ALL_VAL_YR across Canada-bound records = $333,619,712,376, against the US Trade Representative’s published $333.6 billion. Agreement to 0.0% |
| Integrity checks run | Single time-stamp confirmed (no cross-month duplication); 68.9% of records carry zero monthly value with positive year-to-date, confirming the file is a full-year carry-forward rather than December-only; zero negative values; 231 destination countries present, so world totals are complete |
| Commodity labelling | Official US Schedule B 2026 code list. HS6 labels derived from the common content of every ten-digit child of each code. 99.89% of lines matched (106 unmatched, obsolete codes) |
| Known bias | Origin of movement records the shipping state, not the producing state. Census states the series “was not designed to measure the state distribution of US export production.” Verified against USDA production data: soybeans are credited 53% to Louisiana, which grew 0.97% of the 2025 crop. Land-border flows to Canada are reliable; deep-water port flows are not |
| Secondary sources | BEA International Services Table 2.3 (7 July 2026); Bank of Canada Sparks at Bank 2026-6; Statistics Canada; USDA NASS Crop Production 2025 Summary; FEC committee C00894162; SEC EDGAR; current Congressional roster |
| Reproducibility | Parser printed in full in this article. Source file is a free public download requiring no key or registration. Any reader running it should reach $333,619,712,376; if not, we are wrong and want to hear |
| Retrieval date | All sources retrieved and read 27 August 2026 |
Corrections
Every correction to this article is listed here with its date, rather than made silently.
| Date | What was wrong | What it says now |
|---|---|---|
| 27 Aug 2026 | Product labels were taken from the first tariff line beneath each code, mislabelling every code covering more than one good — “bourbon” for all whiskies, “Brazil nuts” for all prepared nuts, and “organic” tiers that do not exist at this level. | All labels rebuilt from the common content of every line beneath each code. |
| 27 Aug 2026 | A “2–5%, lowest of any consumer-facing industry” profitability figure was attributed to the Competition Bureau’s grocery study. | That figure is not in the report. Replaced with the Bureau’s own wording. |
| 27 Aug 2026 | We stated that Canadian rules require a foreign establishment number on imported meat labels, and promised a decoder built on it. | A full-text search of the Safe Food for Canadians Regulations returns no such requirement. The claim and the decoder were withdrawn. |
| 27 Aug 2026 | TikTok was listed as Chinese-owned. | Its US operations were divested in January 2026 to a majority American-owned joint venture. Moved to the American table. |
| 27 Aug 2026 | Inauguration contributions by Apple and OpenAI were shown as corporate donations; Microsoft’s was shown as $1M; DoorDash, Comcast and X were shown as having none. | Corrected against the FEC filing. Apple and OpenAI gave nothing — those were personal gifts by their chief executives. |
| 27 Aug 2026 | Paramount Skydance was placed in Santa Monica, California, and X Corp in Bastrop, Texas. | Paramount Skydance files from New York; xAI merged into SpaceX in February 2026, placing the X platform at Starbase, Texas. |
| 27 Aug 2026 | Domestic travel figures were presented without their window; the counter-tariff explanation was stated more firmly than the Bank of Canada states it. | Figures labelled Q1–Q3 2025; the Bank’s own hedging language restored. |
Sources
Academic references
- Sheeran, P. (2002). “Intention–behaviour relations: A conceptual and empirical review.” European Review of Social Psychology, 12(1), 1–36. Meta-analysis of ten meta-analyses, 422 studies; intention–behaviour correlation r = 0.53, R² = 0.28.
- Klein, J. G., Smith, N. C., & John, A. (2004). “Why We Boycott: Consumer Motivations for Boycott Participation.” Journal of Marketing, 68(3), 92–109. Cost–benefit model tested during an actual multinational boycott; constrained-consumption cost identified as a significant moderator of participation.
- Olson, M. (1965). The Logic of Collective Action: Public Goods and the Theory of Groups. Harvard University Press. Free-riding incentive rises with group size; large diffuse groups under-provide public goods absent a selective incentive.
- Shimp, T. A., & Sharma, S. (1987). “Consumer Ethnocentrism: Construction and Validation of the CETSCALE.” Journal of Marketing Research, 24(3), 280–289.
Every source below was retrieved and read on 27 August 2026.
- US Census Bureau. State Exports HS6 (Origin of Movement), December 2025 file, calendar-year totals. 1,309,098 records, parsed in full. Canada-bound total: $333,619,712,376.
- US Census Bureau. Schedule B export commodity classification, 2026 edition.
- Office of the United States Trade Representative. Canada country page, 2025 goods and services balances.
- US Bureau of Economic Analysis. International Services, Table 2.3, released 7 July 2026 — services to Canada by type.
- Bank of Canada. Olga Bilyk and Jacob Dolinar, Assessing the Buy Canadian movement one year later, Sparks at Bank article 2026-6, 26 February 2026. Views are the authors’, not the Governing Council’s.
- Statistics Canada. Canadian-resident travel to the United States: A year in review.
- Competition Bureau of Canada. Made in Canada claims, modified 14 June 2026.
- Competition Bureau of Canada. Retail Grocery Market Study, June 2023.
- Department of Finance Canada. Rescission of the Digital Services Tax, 29 June 2025.
- Federal Court of Appeal filing, 17 July 2026, on the elimination of the base contribution requirement for foreign streaming services — as reported and documented by Michael Geist.
- Federal Election Commission. Trump-Vance Inaugural Committee, committee C00894162, Form 13 as amended.
- US Securities and Exchange Commission. EDGAR company search — principal executive office addresses read from each registrant’s most recent 10-K or 10-Q cover page, June to August 2026. (SEC rate-limits automated requests; the link opens normally in a browser.)
- Executive Order 14352, Saving TikTok While Protecting National Security, 90 FR 47219.
- USDA National Agricultural Statistics Service. Crop Production 2025 Summary, 12 January 2026.
- Noah Fry, Killam Postdoctoral Fellow, Dalhousie University. “Why the Buy Canadian strategy won’t cost — or deliver — much”, Policy Options, 10 June 2026.
- Canadian Food Inspection Agency country-of-origin enforcement records, as reported by CBC News.
- Ben, Nelson, British Columbia. Recorded telephone conversations, 24 and 26 August 2026, quoted with his consent.

Share:
Canada's Counter Tariffs, 2026: All 874 Items, Every Legal Door — and the One Move That's a Crime
What Happens If Alberta Separates: The Two Scenarios, Verified