

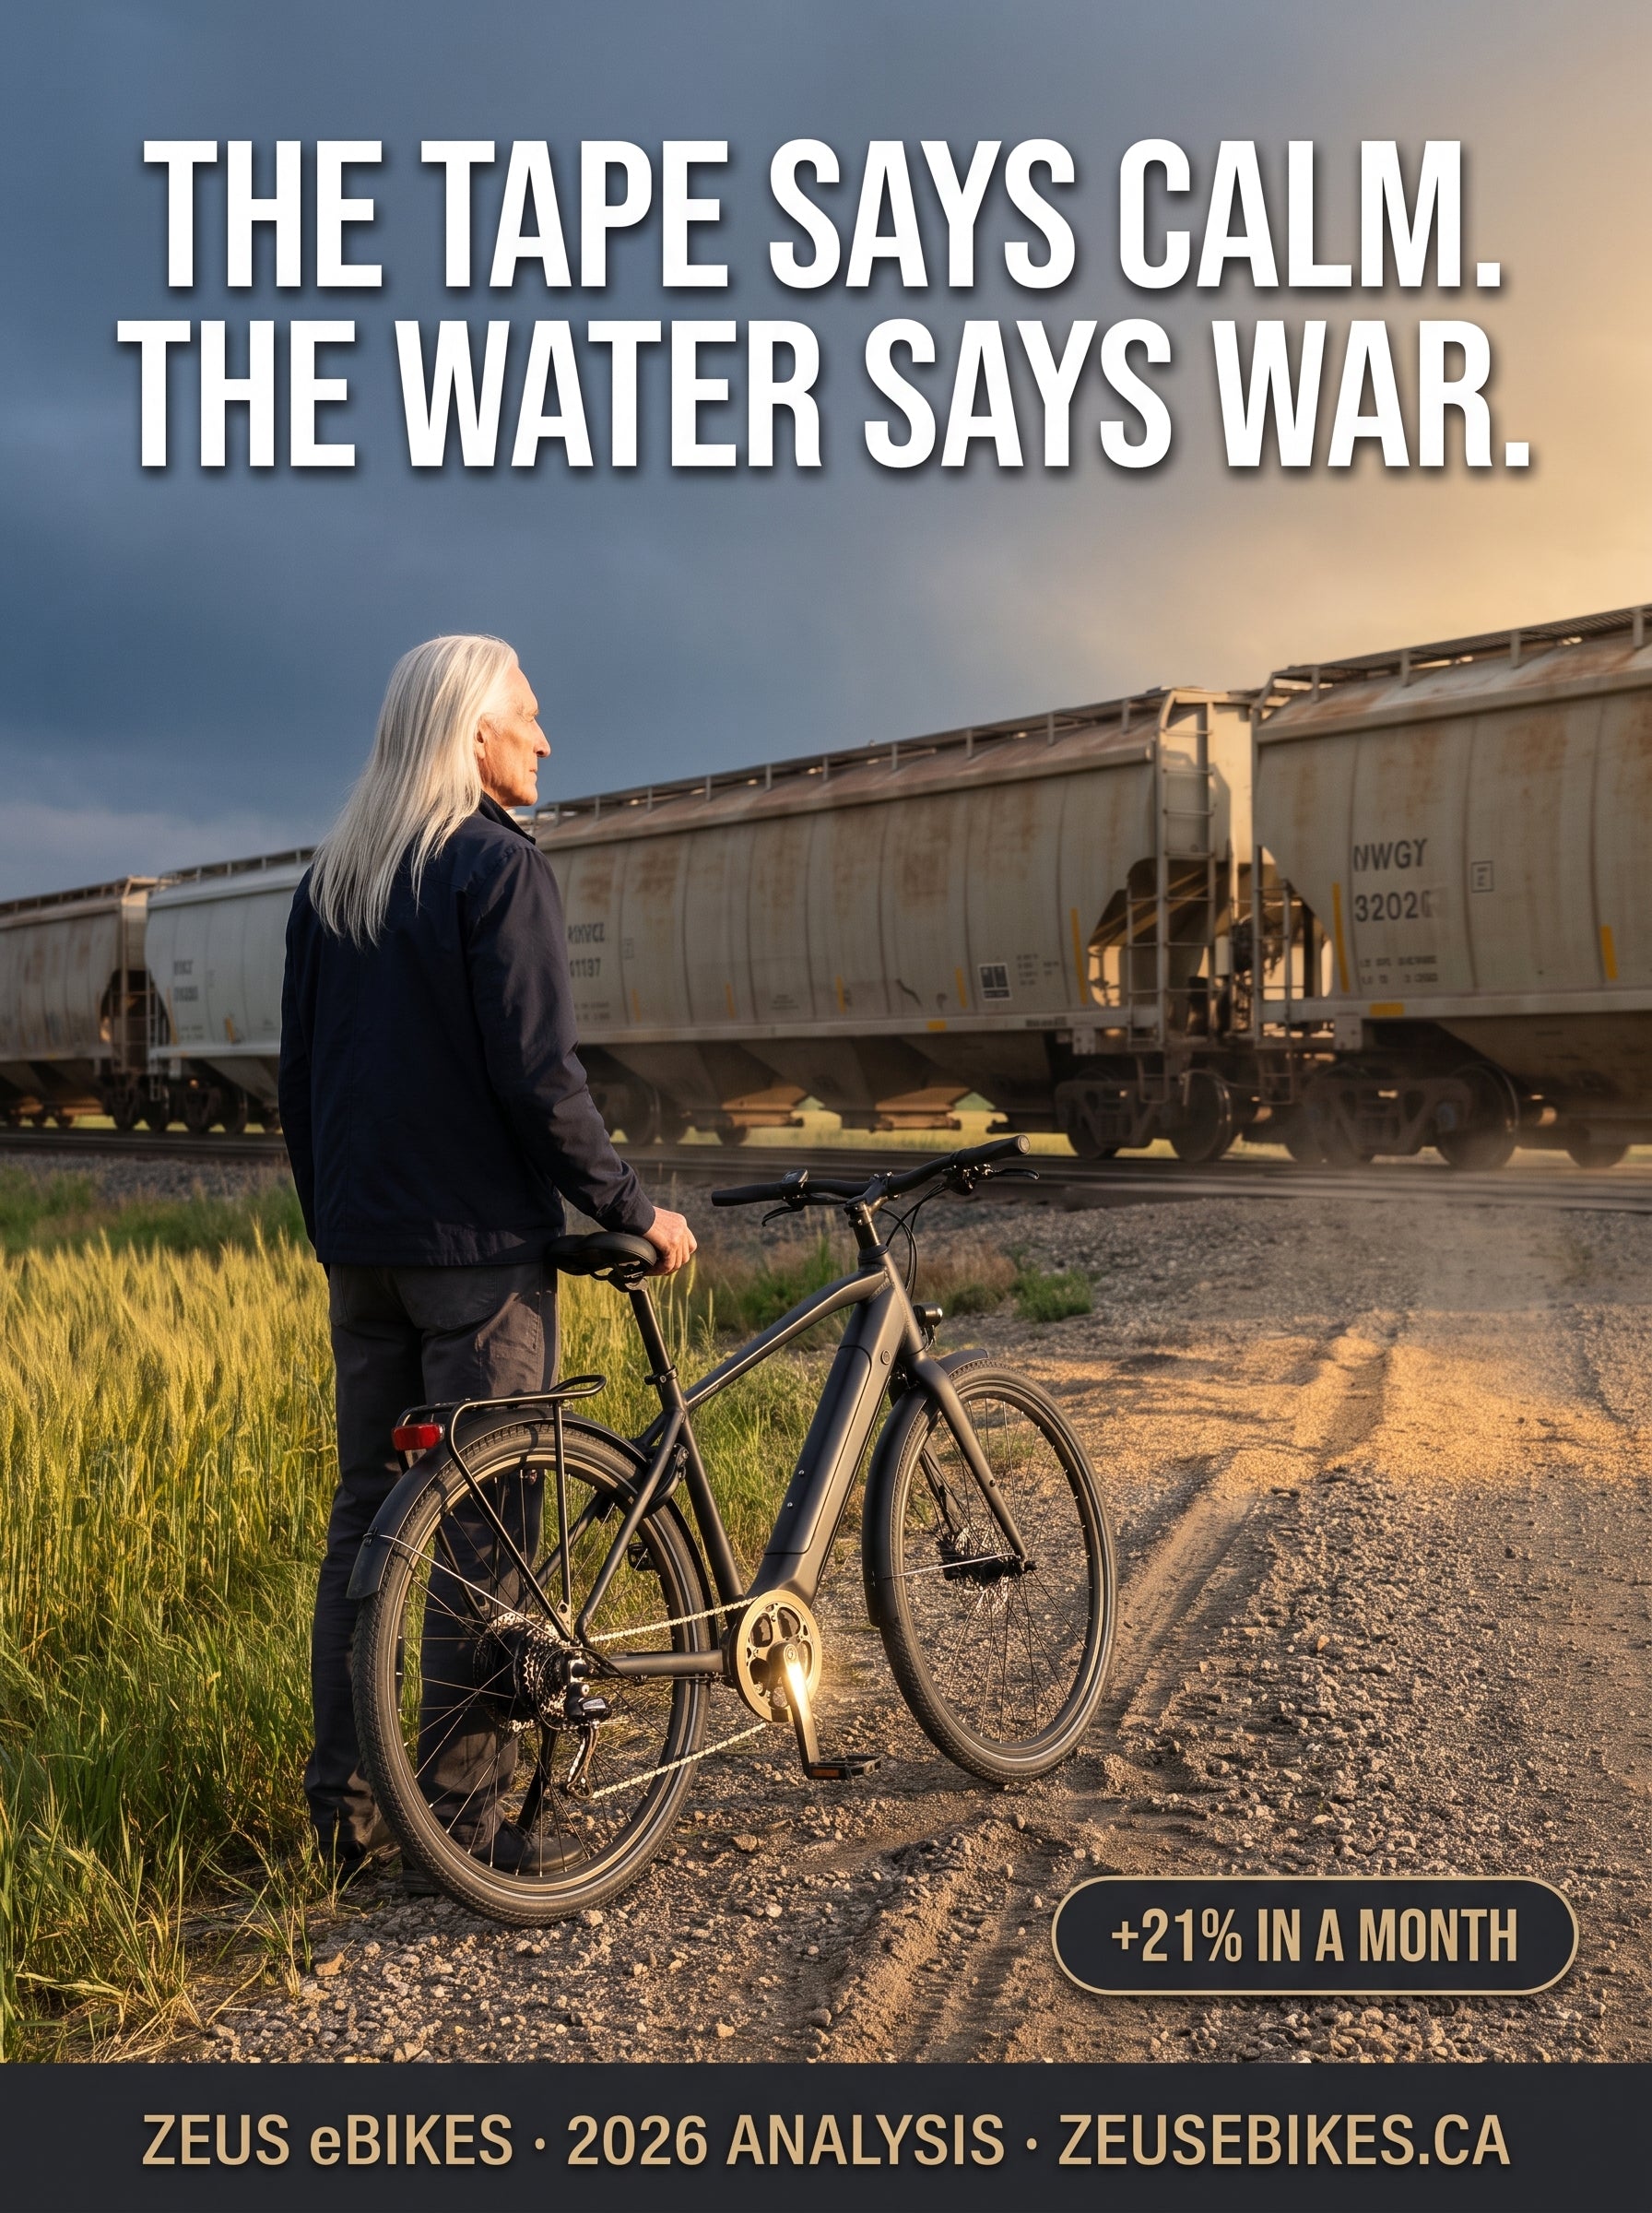
Fertilizer & Food Prices Canada (2026): The War Data Nobody's Pricing In

A grain train meets the storm line on the Saskatchewan prairie. Canada grows the calories; the war reprices the inputs. · AI-generated editorial image (Playcut.ai)
On July 25, 2026, missiles crossed into Saudi Arabia — the heart of the region that supplies a quarter of the world's nitrogen fertilizer exports. The next morning, the global price tape barely blinked. One of those two facts is wrong about the future. This article exists to find out which, using only things that can be counted: ship transits, force majeure notices, futures settlements, inventory reports. The press conferences come last — in a chart at the end, printed word for word beside what the data showed on the same day. If you buy groceries in Canada, the gap between those two columns is your 2027 food bill.
How this analysis was done
Method — measurements first, statements last. Every figure in this article comes from a primary or institutional source that publishes data, not messaging: the WTO's trade-flow blog, the World Bank's commodity outlook, FAO market analysis, IFPRI, CRU Group, Farm Credit Canada, Statistics Canada, the International Maritime Organization, DTN's retail fertilizer survey, Trading Economics benchmark quotes, and dated reporting from CNBC, CNN, CBC News, Al Jazeera, The Washington Post, UkrAgroConsult and Reuters-sourced wires. Official statements — from any government — were deliberately excluded from the analysis until the final section, where they are quoted verbatim, with dates, beside what the measurable record showed at that moment. Where sources conflict, both readings are printed (you will find four such conflicts flagged in the text). Forecasts are always attributed to the institution that made them and labelled as forecasts. All data as of July 27, 2026. This article recommends no specific products and names no bike models; it is analysis, not a catalogue. Editorial photographs in this article are AI-generated images created with Playcut.ai and are illustrative, not documentary records of the events described.
Quick Answer
Fertilizer prices are climbing again because the Iran war expanded in July 2026 — a reinstated naval blockade, Iranian fire reaching Jordan, Qatar and Kuwait, Houthi missiles reaching Saudi territory — and the strait that carries about one-third of the world's seaborne fertilizer remains contested. The benchmark urea price rose 21% in the month to July 24 even as year-to-date numbers look deceptively flat. If the war continues as it has, the documented sequence is: farm input costs rise now, harvest yields fall in 2027, and grocery shelves reprice on a 3–6 month lag that persists 12–18 months (IFPRI). Canada is the least-exposed major country — Saskatchewan potash is a genuine windfall — but Eastern Canadian farms and every Canadian grocery cart still pay world prices. Households can't control a strait; the main controllable line item is transportation, which is why we end with honest math on that — see our gas price explainer and e-bike vs car cost breakdown.
In this article
- What "the war expanded" actually means — the July record
- The molecule that feeds half of humanity
- The real data: five months of the physical world
- The tape vs. the water: who actually sets these prices
- If it continues as it has: the three waves
- Canada's split screen: the windfall and the pinch
- What a household can actually control
- The chart: what they said vs. what the data showed
- Frequently asked questions
- The bottom line
What "The War Expanded" Actually Means — the July Record
On July 8, the truce that was supposed to end the Iran war broke, and within seventeen days the conflict had widened from a two-country air war into a region-wide one: Iranian fire reached Jordan, Qatar, Kuwait and, by Iran's own claim, US facilities in Bahrain and Syria; a US naval blockade went back up; and Houthi missiles struck at Saudi Arabia. If you decide your grocery budget assuming this ends quickly, you are betting against a pattern that has now repeated three times. What follows is the dated record, because everything else in this article hangs on what happened — not on what anyone hoped.
Did the June peace actually fail? Yes, and quickly. The memorandum signed on June 17–18 to end the conflict and reopen the Strait of Hormuz lasted nineteen days: ships were attacked in the strait on July 6–7, President Trump declared the truce over on July 7 (CNN), and by July 8 the United States was striking Iranian territory again while Iran hit US bases in the Gulf states.
Did it stay a two-country war? No. By July 17, CNN's live coverage was headlined "Iran and US widen attacks": Jordan, Qatar and Kuwait each endured Iranian fire, and Iran claimed strikes on US military facilities in Bahrain and Syria. On July 14, CENTCOM confirmed the US naval blockade of Iranian ports was reinstated. On July 23, a Houthi attack in the Red Sea marked what CNN called a new escalation — a second maritime front — and oil closed above $100 US for the first time since spring. On July 25, Yemen's Iran-backed Houthis fired missiles and drones at Saudi Arabia — targeting Aramco facilities in the Red Sea cities of Yanbu and Jizan, by their spokesman's own statement — in response to airstrikes on Hodeida (CBC News). The world's fertilizer-producing heartland is no longer adjacent to the war. It is inside it.
Is it still burning this week? As of this writing, a pause. Neither side launched strikes on July 25 or 26 — the first two-day quiet after roughly two weeks of consecutive nightly bombardment (Al Jazeera). China initiated a diplomatic push on July 17 — a joint call with Pakistan for an immediate end to hostilities (China Global South Project) — and Pakistan and Qatar are now shuttling a proposed formula between the two sides (ANews, July 26). The New York Times reported (via Al Jazeera) that part of the US pause came down to a countable constraint, not a diplomatic one: the Pentagon's dwindling stockpile of missile interceptors. This is pause number three. The April ceasefire collapsed. The June memorandum collapsed in nineteen days. The honest description of the current state is not "peace" — it is a contested strait, under escort, between rounds.

Ships waiting, going nowhere: at the July low, eight vessels a day made the Hormuz passage — some with transponders dark, under naval escort (CNBC, July 13) · AI-generated editorial image (Playcut.ai)
The same month, the other food chokepoint went hot too. In July, Russia and Ukraine intensified attacks on each other's export corridors during peak harvest — Ukrainian strikes on Russian ports and vessels in the Sea of Azov led Russia to close the Kerch Strait, a channel carrying roughly one-third of Russian wheat exports (World Grain, July 2026). Russia and Ukraine together account for more than a quarter of world wheat exports. Wheat climbed to its highest level in two years on the Chicago and Paris exchanges by July 24 (UkrAgroConsult). Fertilizer's chokepoint and wheat's chokepoint, contested in the same thirty days.
Takeaway: "Expanded" is not a figure of speech. Between July 6 and July 25 the war spread to the territory of at least four more states (six, counting Iran's claimed strikes on US facilities in Bahrain and Syria), re-closed one strait, put missiles over the Gulf's fertilizer coast, and coincided with the closure of the Black Sea's main wheat channel. Every pause in 2026 has so far been an intermission, not an ending — plan on the pattern, hope for the exception.
The Molecule That Feeds Half of Humanity
Half the people alive today are fed by crops grown with synthetic nitrogen — some four billion of us, here because a century-old chemical reaction turns natural gas into plant food (Erisman et al., 2008, via Our World in Data). More than half the protein you ate today traces back to it. That is why this war's quietest casualty — fertilizer — matters more to your grocery bill than the oil everyone watches.
The chemistry explains the geography. Nitrogen fertilizer starts as ammonia, made by the Haber-Bosch process, which fuses nitrogen from the air with hydrogen stripped from natural gas. Gas is both the fuel and the raw material — which means the cheapest place on Earth to make nitrogen fertilizer is wherever gas is nearly free. That place is the Persian Gulf. It is not a coincidence; it is thermodynamics with a shipping address.

Where food begins: natural gas becomes ammonia, ammonia becomes urea. Gulf economies supply a quarter of the world's nitrogen fertilizer exports (WTO) · AI-generated editorial image (Playcut.ai)
The result is a dependency most people have never heard of. Gulf economies supply 24.8% of the world's nitrogen fertilizer exports (WTO, July 10, 2026). About one-third of all seaborne fertilizer trade — and by CRU Group's count about 40% of the global urea export market, once Iran is included — normally moves through the Strait of Hormuz, a channel 33 kilometres wide at its narrowest. The region also ships about half of globally traded sulphur (FAO; Argus's fertilizer pricing lead Sarah Marlow cites the same share), the input behind phosphate processing, and a fifth of the world's liquefied natural gas — the LNG that fertilizer plants in India, Pakistan, Bangladesh and Egypt burn to run.
Canada sits at the other end of this molecule map, in the best seat in the house — with two exceptions we'll get to. Saskatchewan holds the world's largest potash reserves and supplied 79% of US potash imports in 2025 (USGS, via Investing News Network). Western Canada makes its own nitrogen from Alberta gas. But Canada mines zero phosphate — all 2.6+ million tonnes a year are imported, about 80% from the United States — and Eastern Canada imports much of its nitrogen by ship, from the Mediterranean and the Caribbean, at whatever the world price happens to be (CBC; Farmtario). Hold that thought.
Takeaway: Fertilizer is natural gas wearing a work shirt. Half of humanity eats because of it, a quarter of the traded nitrogen supply ships from the Gulf, and the whole system funnels through one strait — which is why a war "over there" is a grocery line item here, on a delay.
The Real Data: Five Months of the Physical World
Strip away every statement made at every podium since February, and here is what the measurable world did: tanker traffic through Hormuz collapsed more than 90% within days (FAO), Gulf fertilizer shipments went to approximately zero and stayed there (WTO), the Gulf's flagship urea complex went dark under force majeure, and the benchmark urea price doubled, round-tripped, and is now climbing again — up 21% in the month to July 24. From here, we simply read the tape, dated line by dated line.
The supply side: what physically stopped
Within days of February 28, the FAO's Chief Economist reported tanker traffic through the strait had collapsed by over 90%. Qatar's Mesaieed complex — 5.6 million tonnes of annual urea capacity — shut on March 4 and QatarEnergy declared force majeure as attacks disrupted its energy supply (CRU; Gulf News). Saudi Arabia and the UAE suspended sulphur exports while Red Sea workarounds were sought (Anadolu Agency). Iran halted ammonia production, and India cut urea and ammonia output (World Bank). By the WTO's July accounting, Gulf fertilizer shipments "came to a standstill once the conflict started… and have remained close to zero since then." IFPRI puts the stalled volume at 3.9 million tonnes — 30% of the Gulf states' annual fertilizer exports — as of its July 2 analysis.
The stoppage travelled by pipeline and power grid, not just by ship. Qatari LNG feeds the fertilizer industries of an entire hemisphere: India takes 44% of its LNG from Qatar, Pakistan 100%, Bangladesh 65% (CRU). When those cargoes stopped, Indian urea plants — IFFCO, Chambal, Kribhco, GNFC — cut or halted production; Bangladesh shut four facilities. The same mechanism has a proven worst case: in the June 2025 round of this conflict, every urea plant in Egypt stopped when Israel's Leviathan and Karish gas fields went offline (Argus), because Israeli gas supplies up to 60% of Egypt's gas imports. In 2026 Egypt has kept its plants running on imported LNG — at a price, and with producers conceding the industry is "not fully insulated" if constraints persist (World Fertilizer, March 25). Europe's nitrogen industry, for its part, is running at about 75% capacity, and China has extended fertilizer export restrictions to protect its domestic market until at least August (Farm Credit Canada). Russia has curtailed shipments of key nutrients (Trading Economics, March 24). This is how a regional war becomes a global input shortage: not one big explosion, but a dozen quiet "temporarily suspended" notices.
The price track: doubled, round-tripped, climbing again
One dated series, five months long — the same story the chart below draws. Around $400 US per tonne before the war (WTO). Up ~30% in the first two days after the strikes, per Farm Credit Canada's read of US futures. Egyptian cargoes at $665 a tonne and US NOLA at $620 a short ton by March 6 (CRU). Above $850 in April — an 80% rise from February and the highest level since April 2022 (World Bank; WTO). Then the June truce: tankers rushed out, expectations of resumption built, and the price fell all the way back to $453 in June (WTO) — nearly a full round trip. And then the truce broke. As of July 24: $451 per tonne, up 21.07% in one month (Trading Economics) — a re-spike from the early-July trough that the year-to-date number (−0.4%) completely hides. Sulphur, meanwhile, doubled between January and the spring (World Bank). The European TTF gas benchmark jumped 55% in a single week in early March, from $11 to $17 per MMBtu (CRU). DAP phosphate went from roughly $580 to $770 a tonne (WTO).
The War, Priced in Urea
Benchmark urea spot/futures, USD per tonne · February–July 2026 · one series, three regimes: war premium in, truce premium out, war premium returning.
Sources: WTO data blog (Feb–Jun benchmarks) · Trading Economics (July 24 quote) · World Bank (April peak context). Early-July trough (~$373) derived from the July 24 quote and its one-month change.
The honest counter-signal: North American retail is falling
No cherry-picking: if you ask a US or Canadian fertilizer dealer this week, prices are down. DTN's retail survey shows six straight weeks of declines into mid-July — retail urea at $682 a ton (−7% on the month), anhydrous ammonia back under $1,000 for the first time in seventeen weeks. Three things reconcile the falling retail tape with the rising wholesale one. First, seasonality: July is the post-application trough in North America; almost nobody is buying. Second, lag: retail repriced off the June truce, and the July re-spike hasn't reached the dealer sheet yet. Third, the year-over-year column tells the real story even at retail: anhydrous +26%, MAP +13%, DAP +12%, urea +4% versus last July (DTN). The next scheduled meeting between Canadian farm wallets and the world price is the fall fill season — and then the spring 2027 pre-buy. That is when the wholesale numbers above become someone's invoice.
The physical ledger nobody can spin
Some numbers cannot be talked up or down. As of June 11, the International Maritime Organization counted roughly 1,000 ships and 20,000 crew stranded in the Gulf, past 100 days. After an Indian crew member was killed aboard a struck vessel, India ordered shipowners not to send Indian seafarers into the strait at all (CNN). On July 13, transits fell to a three-week low — 8 ships in a day, down from 15 the day before — with CNBC describing the strait as "largely closed again, a trickle of ships with transponders off," moving under US military escort. At least nine ships have been attacked since July 6. Force majeure notices, seafarer bans, escort convoys, dark transits: this is what the physical record looks like while the year-to-date price column reads "unchanged."

The IMO counted roughly 1,000 ships and 20,000 crew stranded in the Gulf as of June 11 — past 100 days at anchor · AI-generated editorial image (Playcut.ai)
Takeaway: The supply side of the world fertilizer market has been in a documented, measurable standstill for five months — near-zero Gulf shipments, force majeure at the region's flagship producer, plants dark from India to Bangladesh. The price has been far more forgetful than the physical system: it doubled, un-doubled on a truce that lasted nineteen days, and has turned again — 21% in a month. One of those two — the molecules or the tape — has to be wrong. Molecules don't negotiate.
The same war, at your gas pump. We traced how this conflict moved Canadian fuel prices — including why taxes went down while prices went up — in our companion explainer.
The Tape vs. the Water: Who Actually Sets These Prices
Start with a puzzle. On July 24, with a naval blockade in force, Houthi missiles reaching Saudi soil the next day, and a thousand ships stranded, Brent crude fell 4% — because a wire report said Pakistan and China were trying to restart talks (Trading Economics). A market that drops 4% on a rumour of a meeting is not weighing molecules. It is weighing words. Whose words, read by what machinery — answer that, and you understand why the tape stays calm against so loud a war, and why the correction, when it comes, arrives all at once.
Who is doing the trading? Mostly machines. The CFTC's own study of automated trading in futures markets found automation as high as 80% of volume in some product classes — and documented that automated activity spikes at precisely 10:30 a.m. on Wednesdays, the moment the US government's official weekly crude inventory number is released. The regulator's data shows the machines are tuned to trade the official number, at the speed of its release. The winners of 2026's oil volatility, per CNBC's June profile, are quantitative trend-followers running machine-learning models across futures markets; the academic literature now documents crude-oil trading systems built directly on news-sentiment ingestion. None of this is conspiracy — it is the published architecture of the modern market.
Inside the machine: how an AI trader decides what to buy — and what a president is worth
Follow one headline through the pipeline. Step one, ingestion: market-data vendors sell machine-readable news feeds built for algorithms — headlines tokenized, timestamped to the millisecond, and scored for sentiment, relevance and novelty before a human finishes reading the first sentence, with official releases and heads-of-state accounts sitting at the top of the source hierarchy. Step two, the decision: the models do not ask is this true? They ask will price react to it? — and a president scores maximum weight for a structural reason: he can make his words become policy. The system prices the speaker's power over the future, not the statement's accuracy about the present. Step three, execution in milliseconds. Step four, amplification: the trend-following funds — the very winners of 2026's volatility — do not parse news at all; they buy the momentum the first machines just created. Step five, settlement: the overwhelming majority of futures positions are closed or rolled before delivery ever comes due, so this entire loop can run for months without anyone touching a molecule.
Now run the hard case through it. A statement arrives carrying a maximum-weight source tag; the tanker data that could contradict it arrives late, gappy, and transponder-dark. The AI trader does exactly what it was built to do: it trades the statement. Truth gets exactly one vote in this system, and it votes last — at physical procurement, when a state tender or a fall fill season must buy real tonnes that do not exist at the quoted price. That is what April was: the physical buyers arrived, and the paper price lost the argument by 80% in a matter of weeks. The Washington Post ran the human version of this audit on July 16 — “Trump has declared the Strait of Hormuz open. The facts say otherwise.” — and the tape, that same week, kept trading the declaration.

Automation runs as high as 80% of volume in some futures classes, spiking the moment official numbers drop (CFTC). The machines trade the statement, not the manifest · AI-generated editorial image (Playcut.ai)
What happens when that architecture meets a war fought partly in press releases? Exactly what the record shows. July 12: the US President posts that the blockade will resume and ships will pay — Brent jumps 9% in a day, its biggest daily gain since 2020 (CNBC). July 14: the toll idea is retracted — prices ease (The Washington Post). July 24: an unconfirmed report of revived talks — down 4%. The tape is doing its job with perfect fidelity: it is pricing the narrative feed it was built to read. The question is whether the feed matches the water. The water's data — transits at 8 a day, transponders off, escort convoys, 3.9 million tonnes of fertilizer unshipped — is thinner, slower, and partly dark by design: a ship that turns off its transponder literally vanishes from the data stream the machines watch. Someone is unplugging the market's eyes at the exact moment someone else is shouting in its ears.
We know what headline-reading machinery does with bad input, because it has already happened. In April 2013, a hacked Associated Press account posted a false report of explosions at the White House; automated trading wiped roughly $136 billion US from the S&P 500 in about two minutes before humans caught it. In May 2023, an AI-generated image of a fake Pentagon explosion briefly dented US markets the same way. Both times, the price snapped back within minutes — because the false input was corrected within minutes. Now invert the case: if the miscalibration runs the other direction — if the reassuring feed persists for months while the physical disruption compounds — there is no two-minute snap-back. There is April. In April 2026, the fertilizer market performed exactly that correction: urea rose 80% in a matter of weeks when the standstill could no longer be narrated away. The crack spread — the refining margin that is set by physical barrels, not headlines — told the same story in the oil market this spring, trading at levels normally seen with crude near $110 while futures sat far lower (see our gas explainer for that anomaly in full).
To be precise about what this is and isn't. It is a documented fact that automation dominates futures volume, that these systems ingest official data releases and news sentiment, that single official statements moved oil 4–9% in a day this month, and that the physical indicators diverge from the paper price. It is analysis — ours — that a market wired this way will underprice a slow-moving physical shock until delivery forces the issue. We flag the difference because that is the standard this article holds every source to, including itself.
Takeaway: The price on your screen is a real-time vote on the official narrative, cast mostly by machines built to read it. The price at the port is set by whether a ship actually sailed. Those two prices have disagreed for five months. April 2026 showed how fertilizer resolves that disagreement: suddenly, and upward — +80% in weeks. Calm tape is not evidence of calm water.
If It Continues as It Has: the Three Waves
Assume nothing improves and nothing worsens — the war simply continues as it has: contested strait, force majeure, monthly re-escalations, pauses that last days. The documented transmission sequence from strait to shelf runs in three waves: input costs now, harvest yields in 2027, grocery prices from winter 2026–27 into 2028. None of this is our invention; each wave below is anchored to a named institution's published forecast, and each has a precedent that has already run once.
Wave one — input costs (now to fall 2026)
The World Bank's May outlook projects urea prices up nearly 60% on average in 2026, the overall fertilizer index up more than 30%, and potash up about 12% — forecasts made before the July re-escalation. The World Food Programme's field read, from its June assessment: farmers are going through planting seasons amid severe fertilizer shortages and high fuel prices — “expected to have a devastating impact on crop yields and, consequently, on food prices months down the line” (WFP, June 5). In Canada, Farm Credit Canada's margin math shows what that does at the farm gate: a 40% nitrogen cost increase cuts a typical Saskatchewan wheat–canola rotation's margin from $50 an acre to $25 — half the farmer's cushion, gone to one input line. Fertilizer is already 20–25% of the cost of growing a crop this year (CBC). US farm-state leaders are on record with the plain version: the president of the American Farm Bureau Federation calls it a production shock with national-security implications, and South Carolina's farm bureau put it more bluntly — farmers may not be able to finance planting at all (Carnegie Endowment).

Fertilizer is 20–25% of the cost of growing a Canadian crop this year (CBC); a 40% nitrogen increase halves a typical Saskatchewan rotation's margin (Farm Credit Canada) · AI-generated editorial image (Playcut.ai)
Wave two — yields (the 2027 harvest)
Expensive fertilizer becomes missing food through a mechanism IFPRI names precisely: the affordability crisis. When the fertilizer-to-crop price ratio spikes, farmers apply less; when they apply less, yields fall the following season — not this one, which is why everything still looks fine at the supermarket. The FAO's Chief Economist, Máximo Torero, set the threshold in March: a disruption lasting three months or more creates "significant risks to 2026-and-beyond planting decisions and global crop yields." The disruption is now in month five. The last time world fertilizer markets broke — 2022 — the yield damage landed hardest in Côte d'Ivoire, Kenya, Nigeria and South Africa (Carnegie). And the modern floor for what losing fertilizer does to a harvest was set by Sri Lanka, the one country that ran the experiment deliberately: its 2021 agrochemical import ban cut paddy yields 36% in a single season, forced the first rice imports in years, helped collapse the economy, and ended with the president fleeing the country in July 2022 (Springer Food Security; Foreign Policy). Nobody is banning fertilizer today — the strait is doing the rationing instead, one suspension notice at a time.
Wave three — shelves (winter 2026–27 into 2028)
IFPRI's consumer timeline is specific: input shocks take 3–6 months to reach retail food prices, then persist for 12–18 months. Count forward from the July re-escalation and the arithmetic lands the heaviest grocery impact in Canada between this winter and 2028. IFPRI's scenario pair frames the range: the optimistic case has markets normalizing by end-2026 if the conflict ends; the pessimistic case — the "continues as it has" case this article was asked to price — extends the crisis into 2028. At the global bottom of the income ladder, the World Food Programme has already run the numbers: nearly 45 million additional people pushed into acute food insecurity under conditions — a conflict running past mid-year, oil above $100 — that July has now delivered. “If this conflict continues, it will send shockwaves across the globe, and families who already cannot afford their next meal will be hit the hardest,” WFP Deputy Executive Director Carl Skau said when the projection was issued (March 17). The WTO lists 18 economies most exposed through fertilizer import dependence, seven of them least-developed countries. The 2007–08 food crisis, for calibration, produced unrest in dozens of countries; the FAO food price index set its all-time record in March 2022, the last time fertilizer and grain shocks arrived together. Today that index still reads calm — 130.3 in June, gently falling — because June's index measured food grown with last year's fertilizer. July's wheat rally will reach it in August's print. The index is a rear-view mirror on a car that just changed roads.
The scenario, priced: if the war continues as it has, the institutions that measure — not message — converge on the same arc: fertilizer costs up 30–60% on the year (World Bank), application cuts and yield risk materializing in the 2027 crop (FAO threshold passed, IFPRI mechanism engaged), grocery repricing from winter 2026–27 with a 12–18 month tail (IFPRI), and a global hunger surge measured in the tens of millions (WFP). Canada does not escape this — it just enters it last, from the strongest position on Earth. Which is the next section.
Canada's Split Screen: the Windfall and the Pinch
No G7 economy comes out of this shock better positioned than Canada — and none of that position survives the walk to the checkout. The windfall is real: Saskatchewan sits on the world's largest potash reserves in the one nutrient the war didn't touch, and global buyers are moving toward stable suppliers. The pinch is also real: zero domestic phosphate, Eastern farms buying nitrogen at world prices with almost no storage buffer, and a grocery bill that was already outrunning inflation before this war added a syllable. Both halves, with numbers.
The windfall: Saskatchewan's quiet decade
Potash is the war's exempt nutrient — the Gulf's role in potash trade is negligible (WTO), which is why TD's economists could accurately note potash prices stayed "essentially flat" after February 28 even as nitrogen doubled. But flat is relative: potash entered the war already about 20 per cent higher than a year earlier on the 2025 demand rally (The Globe and Mail, February 2026), and the war is now doing for demand what it never had to do for price — pushing buyers toward the most stable supplier on the map. Nutrien forecasts global potash demand of 74–77 million tonnes in 2026 and planned to add another 200,000 tonnes of production across its six Saskatchewan mines — a plan made in February, before the war handed the stable-supplier pitch a megaphone. Canada produced 15 million tonnes in 2025 and supplied 79% of US potash imports (USGS, via Investing News Network). Every tonne of trust the Gulf loses, Saskatchewan is positioned to collect. It is the least-told good-news story in the country right now.

The war's exempt nutrient: Saskatchewan supplied 79% of US potash imports in 2025 (USGS), and the disruption never touched Canada's lane · AI-generated editorial image (Playcut.ai)
The pinch: the East pays the world price
Now the other screen. Canada mines no phosphate — every kilogram of the 2.6+ million tonnes used here is imported, ~80% from the US, the rest from a list that includes Russia, China, Morocco and the Middle East (CBC/Farmtario). On nitrogen, the country splits in two. The Prairies are backstopped by Alberta-gas production and entered the shock with December urea inventories at decade-high levels (Farm Credit Canada). Eastern Canada is the opposite story: nitrogen arrives by ship from the Mediterranean and the Caribbean, on-farm storage is thin — 17% of Quebec producers, 10% of Ontario, 0% in the Maritimes — and December inventories sat at their lowest since 2017. Eastern farms buy close to the moment of use, which means they buy at whatever the world price is that week. Add a standing irritant: tariffs on Russian fertilizer still cost Canadian farmers roughly $100 more per tonne than their American neighbours pay (CBC) — a gap Atlantic grain growers are formally demanding Ottawa remove. Mediterranean nitrogen, remember, means Egypt and Algeria: the same Egyptian industry that stopped entirely in the 2025 round of this war and now runs on imported LNG. Eastern Canada's supply line doesn't cross the Strait of Hormuz — it crosses the war's blast radius.
The grocery cart: the lag is the message
Canadian grocery inflation was 3.9% year-over-year in June — the seventeenth consecutive month groceries outran overall CPI (2.8%), with bread up 6.0% and chicken up 5.7% (Statistics Canada, July 20 release). Five-year grocery inflation stands near 30%. That is the starting point, before wave three of this war arrives on the IFPRI timeline. Ottawa, for the record, does not dispute the exposure: the National Food Security Strategy the Prime Minister launched on June 11 — "a country's sovereignty depends on its ability to feed itself, fuel itself, and defend itself" — concedes in the launch's own words that “our overreliance on foreign suppliers has left us vulnerable to global shocks – to conflicts overseas, to droughts, and to tariffs,” promises faster approvals for fertilizers among other inputs, and puts $3 billion over ten years behind the fix (PMO; Public Services and Procurement Canada). The candid institutional read is TD's: Canada is the least-exposed major economy — under 5% of our fertilizer comes from the Gulf, against 30–40% for the US and Mexico — and, in the same report's words, there is "no immunity from price increases influenced by global trends." Both halves of that sentence are true. The second half is the one your grocery receipt will meet first.

Wave three lands here: groceries have outrun overall Canadian CPI for 17 straight months (Statistics Canada) — and the fertilizer shock has not fully arrived yet · AI-generated editorial image (Playcut.ai)
Takeaway: Read Canada on both screens at once. National: best-positioned country in the world — potash superpower, gas-fed nitrogen in the West, a food-security strategy on paper. Household: a grocery bill already 17 months ahead of CPI, an Eastern farm belt with no storage buffer buying at world prices, and wave three scheduled for winter. National strength does not ring through at the checkout; the world price does.
What a Household Can Actually Control
You cannot convoy a urea carrier, and no federal strategy reprices your February grocery run. The honest list of what a Canadian household controls in this story is short: some of the food line (substitution, less waste), and much more of the other big line the same war is inflating — transportation. Since we sell e-bikes, read this section knowing that; the math below is from our own published, sourced analysis, and it holds whether or not you ever buy anything from us.
The war moved fuel the same way it moved fertilizer — through a strait and a risk premium — and Canadians were already paying an average of about $231 a month for gasoline before this year's spike, with 2026 estimates adding as much as $1,600 at the pumps for an average driver (CP24, via our gas explainer). Full car-ownership math runs about $0.60–0.67 per kilometre; an e-bike moves a person for closer to $0.10 per kilometre, and a year of charging costs $13–30 — the full working is in our e-bike vs car cost comparison and our honest e-bike cost guide. For a two-car household, moving the second car's short trips onto two wheels is the largest single act of war-proofing a family budget can perform this year; for a one-car household, it is the difference between absorbing wave three and financing it. We are not naming models here — that is not this article's job. If the math interests you, the commuter lineup and step-through range are where Canadians usually start, every bike ships from Canada, and a human answers at 1-866-938-7580 if you'd rather talk it through than read another chart. Unused, unopened bikes can be returned within 15 days of delivery, less a 15% restocking fee.

The line item a household still controls: an e-bike moves a person for roughly $0.10 a kilometre, against $0.60-plus for a car · AI-generated editorial image (Playcut.ai)
One war, three household bills — we've now covered all three. Fuel, tariffs, and food. The other two analyses are live:
The Hormuz Effect on Gas Prices → · The Trade-War Playbook →
The Chart: What They Said vs. What the Data Showed
This is the chart this article was built to earn. The left column is what officials and institutions said, quoted with dates. The right column is what the measurable record showed at that same moment, from the named source. We grade only one row in anyone's favour, and we let the others grade themselves. Clip it, share it, and re-read it the next time a podium tells you the water is calm.
| WHAT WAS SAID (dated, verbatim) | WHAT THE DATA SHOWED (dated, sourced) |
|---|---|
|
"[The strait] is open to ALL Ship traffic except for Iran." — US President Donald Trump, Truth Social, July 14, 2026 (via The Washington Post) |
Transits at a three-week low the day before: 8 ships in a day, down from 15; "largely closed again, a trickle of ships with transponders off," moving under US military escort (CNBC, July 13). ~1,000 ships and 20,000 crew stranded in the Gulf 100+ days (IMO, June 11). Two days after the post, The Washington Post published its own verdict: “Trump has declared the Strait of Hormuz open. The facts say otherwise.” (July 16) |
|
Freedom of navigation "remains available" — the strait is open "to all vessels seeking to lawfully transit." — US CENTCOM statement, July 2026 (via The Washington Post) |
At least 9 ships attacked since July 6 (CNBC). India ordered shipowners not to deploy Indian seafarers through the strait after a crew death (CNN). Lawful transit now requires a warship escort. |
|
The June 17–18 memorandum: conflict ended, strait reopening. — US–Iran MOU, June 2026 |
Held 19 days. Ships attacked July 6–7; truce declared over July 7; strikes resumed July 8; naval blockade reinstated July 14 (CNN; Wikipedia timeline of the campaign). Third pause of 2026 now underway — the April ceasefire and June MOU both collapsed. |
|
"We have also halted our retaliatory operations." — Iranian army spokesman Mohammad Akraminia, July 26, 2026 (Al Jazeera) |
True the day it was said — and said after ~two weeks of consecutive nightly exchanges, with The New York Times reporting (via Al Jazeera) that the US pause traced partly to depleted interceptor stockpiles, not de-escalation. The physical blockade remained in force. |
|
Fertilizer shortage will have "only modest effect on food inflation in Canada." — TD Economics report, via The Globe and Mail headline, May 11, 2026 |
The row we grade fairly: partly right. Canada IS the least-exposed major economy (<5% Gulf imports; potash flat). But the same report's caveat — "no immunity from price increases influenced by global trends" — is the operative line: benchmark urea +21% in the month to July 24 (Trading Economics), and Ottawa's own June 11 food-security launch concedes “overreliance on foreign suppliers has left us vulnerable to global shocks – to conflicts overseas.” |
| The aggregate tape, June–July: FAO food index easing (130.3, −0.3% in June); US retail fertilizer down six straight weeks into mid-July (DTN); urea year-to-date roughly flat. | Wheat at two-year highs July 24 (UkrAgroConsult). Urea +21% in a month (Trading Economics). World Bank 2026 forecasts: fertilizer index +30%, urea +~60%. The June food index measured crops grown on pre-war fertilizer — the rear-view mirror, not the road. |
| Spring force-majeure notices framed as temporary suspensions; June restart narratives from Gulf producers. | Gulf fertilizer shipments "came to a standstill once the conflict started… and have remained close to zero since then" (WTO, July 10). 3.9 million tonnes suspended = 30% of Gulf annual fertilizer exports (IFPRI, July 2). Qatar's 5.6 Mt/y Mesaieed complex shut since March 4 (CRU). |
|
The oil market's verdict, July 24: Brent −4% on a report that Pakistan and China sought to revive talks. — Trading Economics, July 24, 2026 |
The same week: naval blockade in force, Houthi missiles and drones at Saudi Arabia (July 25, CBC News), Red Sea escalation (July 23, CNN), Pentagon interceptor stocks reportedly strained. In 2022, a war with no closed strait took Brent to $127. This one, with the strait contested, trades near $97. |
Two columns, one method. When the left column and the right column agree, believe both. When they diverge — and they have diverged for five months — the right column is the one that eventually sends an invoice. April's 80% urea repricing was the right column collecting. If the war continues as it has, the next collection is scheduled for the fall fill season, the spring 2027 pre-buy, and the grocery aisle after that.
Frequently Asked Questions
Why is fertilizer so expensive in Canada right now?
Because fertilizer is priced globally, and the world's main fertilizer artery is a war zone. About one-third of the world's seaborne fertilizer trade normally transits the Strait of Hormuz (FAO). Since the war began on February 28, 2026, Gulf fertilizer shipments have sat near zero (WTO), Qatar's flagship urea complex shut under force majeure, Saudi Arabia and the UAE suspended sulphur exports, and the benchmark urea price rose 21% in the month to July 24 alone (Trading Economics). Canada buys less than 5% of its fertilizer directly from the Gulf — but Canadian farmers still pay the world price.
Why is so much fertilizer produced in the Middle East?
Natural gas. Nitrogen fertilizer is made by converting natural gas into ammonia through the Haber-Bosch process, and Gulf producers sit on some of the cheapest gas on Earth. That is why Gulf economies supply roughly a quarter of the world's nitrogen fertilizer exports (WTO) and about half of globally traded sulphur (FAO), and why one narrow strait matters so much to the price of food everywhere.
Why are fertilizer prices affected by oil and gas prices?
Natural gas is the main feedstock for nitrogen fertilizer — it is both the energy source and the hydrogen source for making ammonia. When the war pushed the European TTF gas benchmark up 55% in a single week in early March 2026 (CRU), the production cost of every tonne of ammonia and urea rose with it. Fuel also moves fertilizer: freight, trucking and application costs all track diesel.
Will food prices go up in Canada in 2026 and 2027?
Canadian grocery inflation is already running at 3.9% year over year (Statistics Canada, June 2026) — the 17th straight month above overall CPI. The fertilizer shock has not fully landed on shelves yet: IFPRI's analysis says input-cost shocks take roughly 3–6 months to reach retail food prices and then persist for 12–18 months. If the war continues, the heaviest grocery impact arrives from winter 2026–27 onward.
Does Canada make its own fertilizer?
Partly. Canada is the world's largest potash producer and exporter — Saskatchewan supplied 79% of US potash imports in 2025 — and Western Canada makes nitrogen fertilizer from Alberta natural gas. But Canada produces no phosphate at all: more than 2.6 million tonnes are imported every year, about 80% from the United States. Eastern Canada also imports much of its nitrogen by ship, at world prices.
Is Canada running out of fertilizer?
No — availability is not the immediate Canadian problem; price is. Farm Credit Canada notes Prairie inventories entered the shock at decade-high levels, while Eastern Canada holds far less on-farm (17% of Quebec and 10% of Ontario producers store fertilizer on-farm; 0% in the Maritimes) and buys closer to the moment of use. The risk is that the fall 2026 fill season and spring 2027 buying season reprice at post-war world prices.
What is the urea price forecast for 2026?
The World Bank's May 2026 commodity outlook projects urea prices to rise nearly 60% on average in 2026, with the overall fertilizer index up more than 30% and potash up about 12%. The benchmark spot price sat at $451 US per tonne on July 24, 2026 — up 21% in one month — after peaking above $850 in April. All of these forecasts assume the range of war outcomes; a durable peace would pull them down, a longer war would push through them.
What happens to food prices if the Iran war continues?
The documented sequence runs in three waves: input costs rise first (happening now), harvest yields fall next as farmers cut application (the 2027 risk — IFPRI calls this the affordability crisis), and grocery prices follow with a 3–6 month lag that persists 12–18 months. The World Food Programme projects almost 45 million more people could fall into acute food insecurity under the conditions the war has already met. IFPRI's pessimistic scenario extends the crisis into 2028.
Is the Strait of Hormuz open right now?
Contested. As of late July 2026, the strait is officially described as open, but transits fell to a three-week low of 8 ships in a day (versus roughly 15 the day before, and far more pre-war), some ships move with transponders off, the US Navy escorts convoys, a US naval blockade of Iranian ports was reinstated on July 14, and the IMO reported about 1,000 ships and 20,000 crew stranded in the Gulf for over 100 days as of June 11.
Why are wheat prices rising in July 2026?
Two wars touched food chokepoints in the same month. Wheat hit two-year highs on the Chicago and Paris exchanges on July 24, 2026 (UkrAgroConsult) after Ukrainian attacks in the Sea of Azov led Russia to close the Kerch Strait — a channel carrying roughly one-third of Russian wheat exports — while the Middle East war kept fertilizer and fuel costs elevated. Russia and Ukraine together account for more than a quarter of world wheat exports.
How much of the world's food depends on synthetic fertilizer?
About half of humanity is fed by crops grown with synthetic nitrogen. Research by Erisman and colleagues (2008), maintained by Our World in Data, estimates roughly 48% of the world's population depends on food grown with Haber-Bosch nitrogen — about 4 billion people — and more than half the protein humans eat traces back to it. That is why a fertilizer shock is a food shock on a delay.
Does the war help Saskatchewan potash?
Largely yes, on the demand side. The Gulf's role in potash trade is negligible (WTO), so the war did not disrupt Canada's lane — TD notes potash prices stayed essentially flat after February 28 — while global buyers looking for stable suppliers land on Saskatchewan, which holds the world's largest reserves. Nutrien forecasts global potash demand of 74–77 million tonnes in 2026 and planned additional Saskatchewan production before the war even began.
The Bottom Line
Read the measurements, not the microphones. The measurements say: the strait that carries a third of the world's fertilizer has been effectively broken for five months, the war around it widened to at least four more countries in July, every 2026 pause has collapsed, and the repricing has begun — 21% on urea in a month, wheat at two-year highs, with the World Bank pencilling in a 30–60% fertilizer year and IFPRI's clock putting the grocery impact on Canadian shelves from this winter into 2028. Canada holds the best hand at the table — Saskatchewan's potash windfall is real — and Canadian households will still pay the world price at the checkout, because that is what world prices do.
You can't reroute a tanker. You can decide, before wave three arrives, which of your own line items still belongs to you — and for most households the biggest one is how you move. Run the numbers in our e-bike vs car cost comparison, or skip the reading and call a human at 1-866-938-7580 — we'll tell you honestly whether the math works for your situation.
Start where the savings are largest. Street-legal, ships from Canada, real support on the phone.
More Zeus guides on the same storm system: the Hormuz effect on Canadian gas prices · the trade-war playbook and Canada's leverage · why Canada was already expensive before the war · the practical Canadian guide to a world at war.
Written by Milad Ghobadibeygvand, BScN (Western University, 2014) — Co-founder, Zeus eBikes Canada. Published July 27, 2026. All market data as of July 27, 2026; the war status described is the record through that date. Corrections: milad@zeusebikes.ca.
Visuals created by Playcut.ai



Share:
Welcome to Earth — Chapter One: The First Thing You Need to Know
It's Not an Accident. It's a Blueprint. — Why Cyclists and E-Bike Riders Die on Canadian Roads