
eBikes & Mental Health in Canada: 7 Research-Backed Pathways Beyond Exercise (2026)

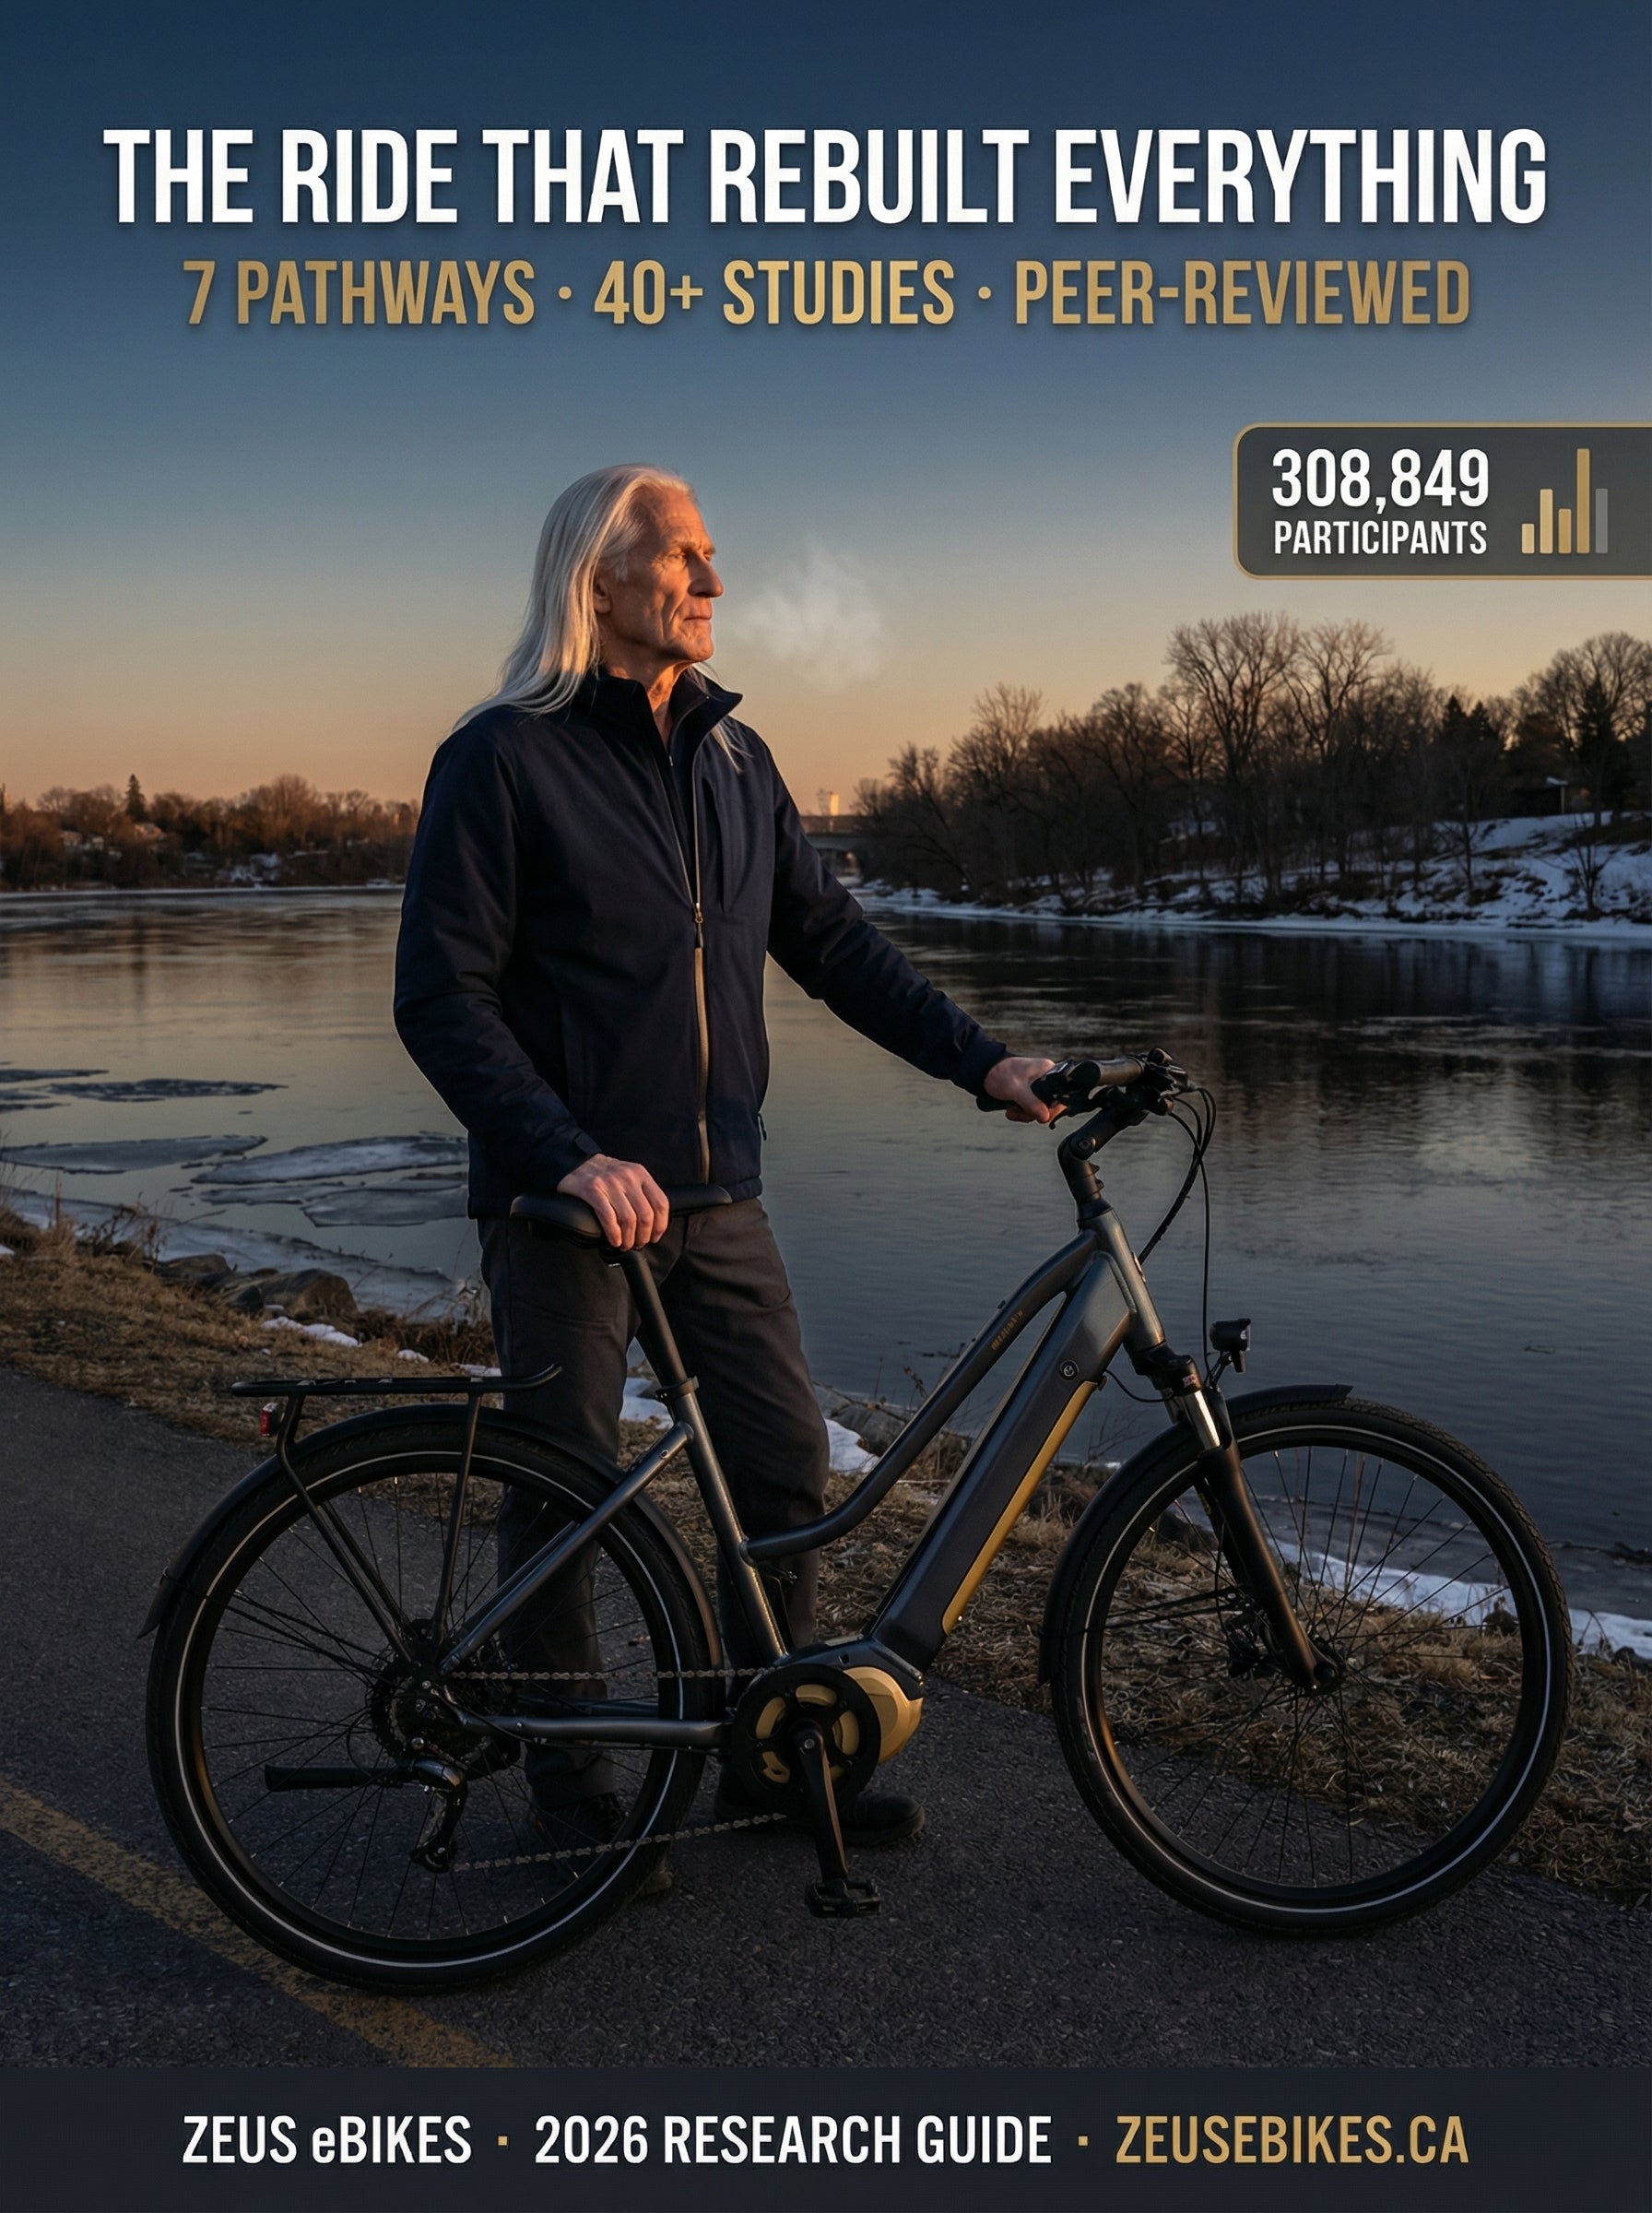
An e-bike is not an exercise machine. It is a mobility intervention that unlocks 7 independently documented mental health pathways:
- Autonomy: Across 184 independent datasets, satisfying the basic psychological needs — autonomy among them — correlates with positive mental health at ρ = .22–.62 (Ng et al., Perspectives on Psychological Science).
- Employment access: Car access increased the probability of employment and of leaving welfare in a longitudinal Tennessee study (Gurley & Bruce, 2005). 34% of unemployed people have clinical psychological problems vs 16% of employed (Paul & Moser, 324 studies).
- Social connection: Strong relationships increase survival by 50% (Holt-Lunstad, n=308,849). In-person contact is associated with 43% lower depression odds; phone and digital contact showed no comparable effect.
- Sunlight & outdoors: Each extra hour outside is associated with 2–8% lower depression odds (UK Biobank, n=400,000+). Health Canada reports Canadians spend about 90% of their time indoors.
- Food security: Vehicle access was associated with 24% lower food-insecurity risk in a Baltimore public-housing study (Martinez et al.). 24% of people in Canada lived in food-insecure households in 2025 (PROOF).
- Financial relief: The lowest incomes carry 1.5–3x the depression/anxiety risk (Science). The average Canadian household spent $12,090 on transportation in 2023 (Statistics Canada).
- Physical activity: Moderate-intensity exercise, though the evidence for e-bikes specifically is weaker than the other 6 pathways.
Why Everyone Gets This Wrong: The Exercise Myth
Every article about e-bikes and mental health makes the same argument: riding is exercise, exercise releases endorphins, endorphins improve mood. It is not wrong. It is just the smallest part of the story — and for the people who need an e-bike most, it is not the part that matters.
Consider a person without a car. A single parent working split shifts. A young adult in recovery. A new immigrant in a suburban neighbourhood with no transit. A senior who surrendered their licence. For these Canadians, the problem is not "I need more exercise." The problem is "I cannot get to the places that keep me well." The job. The counsellor. The friend. The grocery store with real produce. The park where the sun is.
An e-bike does not solve the exercise problem. It solves the mobility problem. And mobility, as the research shows across multiple independent fields, unlocks at least 7 mechanisms that are each independently associated with better mental health. Exercise is just one of them — and honestly, the weakest one in terms of e-bike-specific evidence.
What follows is what each of those 7 pathways looks like when you trace it through the peer-reviewed literature. Every statistic is cited. The limitations are real and included in full at the end. This is not advocacy disguised as science. It is the science, with the gaps acknowledged.
If an e-bike ever enters your life, the frame matters. It is not a piece of exercise equipment. It is a vehicle that changes where you can go, who you can see, and what you can afford — and each of those changes has documented effects on how you feel.
 Pathway 1 · Autonomy
Pathway 1 — Autonomy: The Freedom to Move on Your Terms
Autonomy is one of the three basic psychological needs identified by Self-Determination Theory, alongside competence and relatedness — the framework Deci & Ryan (2000) laid out in Psychological Inquiry and defended across decades of research. Ng et al. (2012) tested it at scale: across 184 independent datasets meta-analysed in Perspectives on Psychological Science, satisfaction of these psychological needs correlated with positive mental health at ρ = .22 to .62 — moderate-to-strong effects, with none of the confidence intervals crossing zero.
What does autonomy mean in practical terms? It means choosing when you leave, where you go, and how you get there — without depending on someone else's schedule, a bus route, or a ride that may not come. For Canadians who rely on others for transport, the loss of autonomy is not abstract. It is daily. Every appointment requires coordination. Every social plan depends on availability. Every errand is contingent.
Delbosc & Currie (2011) studied this directly. In a survey of 535 adults across greater Melbourne published in Transport Policy, transport disadvantage was significantly associated with lower subjective wellbeing — and the outcomes were worst where transport disadvantage combined with social exclusion. The people who could not get around were, measurably, doing worse.
An e-bike restores that autonomy. Unlike public transit, it runs on your schedule. Unlike a car, it costs a fraction to operate. Unlike a conventional bicycle, it is accessible to people with limited fitness, joint issues, or the kind of exhaustion that comes with shift work, caregiving, or early recovery. Frame design matters here too: a step-through frame means no leg swing over a high top tube, which for someone recovering from hip surgery, managing arthritis, or simply wearing work clothes is the difference between riding and not riding. The principle applies to anyone whose mobility is constrained.
 Pathway 2 · Employment
Pathway 2 — Employment Access: More Shifts, More Income, More Stability
Unemployment does not just reduce income. It damages mental health through a mechanism that is separate from money. Paul & Moser (2009) analysed 237 cross-sectional and 87 longitudinal studies in the Journal of Vocational Behavior and found a distress effect size of d = 0.51 — a medium-to-large effect. The number that lands hardest: 34% of unemployed individuals show clinical psychological problems, versus 16% of employed individuals. That is not a gradual difference. It is double. Their meta-analyses of longitudinal studies and natural experiments support the harder claim too: unemployment does not merely correlate with distress — it causes it.
Now add geography. In New York City, neighbourhoods with insufficient transit access carry a 12.6% unemployment rate, against 8.1% in the best-connected neighbourhoods (Kaufman et al., 2015, as carried in the Urban Institute's mobility framework). And Gurley & Bruce (2005), following Tennessee welfare recipients across four survey waves in the Journal of Urban Economics, found that gaining car access increased the probability of being employed and of leaving welfare — and led to more hours of work and better-paying jobs.
For the working poor who do have jobs, the cost of getting there is its own burden. The average Canadian household spent $12,090 on transportation in 2023 — up 19.7% from 2021 — including $2,567 on gasoline and other fuels (Statistics Canada, Survey of Household Spending). Every dollar spent getting to work is a dollar unavailable for everything else.
An e-bike eliminates the commute cost almost entirely. Electricity for a full charge costs pennies. Maintenance is minimal. There is no insurance, no parking, no fuel. For someone working split shifts, early mornings, or late evenings — when buses run infrequently or not at all — the e-bike is the difference between taking the shift and turning it down.
 Pathway 3 · Social Connection
Pathway 3 — Social Connection: See the People Who Matter
This is the pathway with the largest effect size in the entire article — and possibly the most underappreciated mechanism in mental health. Holt-Lunstad et al. (2010) analysed 148 studies encompassing 308,849 participants and published the findings in PLoS Medicine. The result: individuals with stronger social relationships had a 50% increased likelihood of survival — an influence the authors rank alongside well-established mortality risk factors like smoking. A follow-up meta-analysis (Holt-Lunstad et al., 2015) found that social isolation increases the likelihood of mortality by 29%.
In Canada, the scale of disconnection is documented. In the Canadian Social Survey (Statistics Canada, 2021), 13% of people aged 15 and older said they always or often felt lonely and another 30% said they sometimes did — 43% experiencing at least periodic loneliness. Among those who always or often feel lonely, 49% rate their mental health as fair or poor, against 7% of those who rarely or never do. Loneliness is not evenly distributed by age, either — Canada's teen loneliness crisis runs through even the kids who look fine.
The critical nuance is the type of contact. Teo et al. (2015) followed 11,065 adults and found that in-person social contact with friends 1–2 times per week was associated with an odds ratio of 0.57 for later depressive symptoms — a 43% reduction in the odds. Telephone and written or email contact showed no comparable protective effect. You have to physically be in the same room as the people who matter. Text messages do not substitute. You have to get there.
Transportation is one of the structural mechanisms behind that gap. A scoping review in the Canadian Journal on Aging (Lamanna et al., 2020) identifies inadequate transportation as a recognized barrier to social participation for older adults — people are not isolated because they do not want to see anyone. They are isolated because they cannot get to them. The person who stops driving does not stop wanting company.
For Canadians without a car — especially in suburban and rural settings where bus service is sparse — an e-bike converts social isolation from a structural problem to a solvable one. A 15 km ride to a friend's house takes 30–40 minutes on an e-bike. It costs nothing in fuel. It does not require coordinating a ride. And unlike transit, it runs at 10 PM when you want to stay late.
 Pathway 4 · Sunlight
Pathway 4 — Sunlight & Outdoor Exposure: Light Is Medicine
Health Canada reports that Canadians spend approximately 90% of their time indoors — roughly 21 to 22 hours of every day. The consequences of this are measurable and large. Burns et al. (2021) analysed UK Biobank data from over 400,000 participants and found that each additional hour spent outdoors was associated with an odds ratio of 0.92–0.98 for major depression and 1.41–1.48 for self-reported happiness. More time outside, less depression, more happiness — in one of the largest cohort studies ever conducted.
The light exposure mechanism is biological, not just psychological. The standard clinical light box delivers 10,000 lux precisely because ordinary indoor lighting falls so far short of outdoor daylight (Harvard Health, 2022). A meta-analysis published in JAMA Psychiatry (2025; 11 trials, n=858) found that bright light therapy nearly doubled remission in non-seasonal depression — 40.7% versus 23.5% for controls (OR 2.42). This is not about seasonal affective disorder. Light helps depression generally.
The vitamin D pathway adds another layer. Anglin et al. (2013) meta-analysed studies totalling 31,424 participants and found that the lowest vitamin D categories, compared with the highest, carried a hazard ratio of 2.21 for depression in the cohort studies — more than double the risk. Patten et al. (2017), pooling ten national Canadian surveys with over 500,000 respondents, found that January depression prevalence is 70% higher than August. That is not a small seasonal dip. It is a 70% swing that tracks with daylight hours and outdoor time.
An e-bike does not cure depression. But it does one thing that the research says matters: it gets you outside, in natural light, regularly. A 30-minute ride puts you in outdoor daylight at intensities no office ceiling can match — and for Canadians whose bikes can handle shoulder-season conditions, that exposure extends deeper into the months when it matters most.
 Pathway 5 · Food Security
Pathway 5 — Food Security: Better Groceries, Better Nutrition
Twenty-four per cent of people in Canada — about 9.8 million, including 2.4 million children — lived in food-insecure households in 2025 (PROOF, University of Toronto). The mental health consequences are severe and specific. Jessiman-Perreault & McIntyre (2017), in a pooled Canadian Community Health Survey sample of 302,683 adults, found that severe food insecurity is associated with 12.4 percentage points more major depressive episodes and 16.0 percentage points more suicidal thoughts compared to food-secure households. These are not correlations buried in subscale scores. They are clinically significant differences in the most serious outcomes.
Transport is a direct contributor. In a study of Baltimore public-housing residents, access to a personal vehicle was associated with 24% lower risk of food insecurity (adjusted relative risk 0.76 — Martinez et al., 2019). Without transport, people are limited to what is within walking distance — which, in many neighbourhoods, means convenience stores and gas stations. A market-basket study published by the CDC found convenience-store prices were 35% higher for fruit and vegetables and 73% higher for meats than supermarkets (Canales et al., 2021). So the transport-poor pay more and get worse food. The downstream effect on nutrition and mental health is predictable.
The dietary link to depression has its own evidence base. Jacka et al. (2017) published the SMILES trial in BMC Medicine: in a sample of 67 adults with moderate-to-severe depression, dietary improvement produced depression remission in 32.3% of the intervention group versus 8.0% of controls — an effect size of d = -1.16. That is a very large effect, though the sample was small and there was differential attrition between groups (limitations noted fully in the honest limitations section).
An e-bike with cargo capacity converts a food desert into a food-accessible zone. A 5 km ride to a proper grocery store takes 15 minutes. With a rear rack, front basket, or panniers, a single trip can carry a week's worth of produce. For families managing food insecurity, the ability to reach affordable, nutritious food without bus transfers, without time constraints, and without the physical exhaustion of walking with heavy bags is a material change in daily life.
 Pathway 6 · Financial Relief
Pathway 6 — Financial Relief: $9,500/Year Changes Everything
The relationship between poverty and mental illness is one of the most replicated findings in psychiatric epidemiology. Ridley, Rao, Schilbach & Patel (2020), published in Science (open copy at MIT), synthesised the global evidence: the lowest income groups face 1.5–3x the risk of depression and anxiety compared to the richest. The causality runs both ways — negative economic shocks cause mental illness, and antipoverty programs improve mental health: their corrected meta-analytic estimates put cash transfers at 0.073 standard deviations of mental-health improvement and multifaceted antipoverty programs at 0.138. CAMH reports that the lowest income group in Canada is 3–4 times more likely than the highest to report poor to fair mental health.
Now consider what getting around costs. Statistics Canada's Survey of Household Spending puts average household transportation spending at $12,090 in 2023 — up 19.7% from 2021 — and for most households that is overwhelmingly the car: fuel, insurance, maintenance, financing, depreciation, parking. (Where that insurance money goes is its own story — see why car insurance costs what it does in Canada.) E-bike annual operating costs run roughly $200–530 by our own editorial estimate: electricity for charging, periodic brake pad and tire replacement, and optional insurance. For a household that fully replaces a car, the arithmetic gap is roughly $9,500–11,800 per year.
That $9,500 is not abstract. For a family at or near the poverty line, it is the difference between food insecurity and food security. Between paying rent on time and falling behind. Between affording a child's sports league or not. Between the chronic stress of financial precarity and the experience of having some margin. Canada's car dependency runs deep — we have written about what Canadians collectively send to foreign auto companies every year, and it is one thread in the larger story of why life in Canada costs so much.
The financial relief pathway is not about saving money as a lifestyle choice. It is about what happens psychologically when a person in precarity gains thousands of dollars of annual breathing room. The Science review says relief from poverty improves mental health. The CAMH data says the starting point is 3–4x worse for the lowest income group. The math is direct.
The Real Cost Comparison
The ranges below are Zeus editorial estimates of typical Canadian car costs; the $12,090 anchor is Statistics Canada's measured average household transportation spend for 2023.
| Cost Category | Car (Annual) | E-Bike (Annual) |
|---|---|---|
| Fuel / Electricity | $2,500–3,500 | $15–30 |
| Insurance | $1,500–2,500 | $0–100 (optional) |
| Maintenance | $800–1,500 | $50–150 |
| Financing / Depreciation | $4,000–6,000 | $200–400 (amortised) |
| Parking | $500–2,500 | $0 |
| Total | ~$12,090 (StatsCan avg household transportation spend, 2023) | $200–530 (Zeus estimate) |
| Annual gap, if a car is fully replaced | ~$9,500–11,800/year (Zeus derivation) | |
Note: Battery replacement ($400–800 every 3–5 years) is not included in the annual e-bike figure above. See honest limitations for full disclosure.
 Pathway 7 · Physical Activity
Pathway 7 — Physical Activity: The Pathway Everyone Already Knows
This is the pathway that every e-bike mental health article leads with. We are putting it last — deliberately — because the evidence for e-bikes specifically is weaker than the other 6 pathways, and intellectual honesty requires saying so.
The general evidence for exercise and mental health is strong. That is not in dispute. Moderate physical activity reduces depression, anxiety, and stress through well-documented biological mechanisms: endorphin release, cortisol regulation, neuroplasticity, and improved sleep architecture. Hundreds of studies confirm this.
The e-bike-specific evidence is more limited. Here is what it actually shows:
Bourne et al. (2018), in a systematic review, found that e-biking provides physical activity of at least moderate intensity — estimated energy expenditure of 4.9–8.3 METs across the included studies, with self-selected riding intensities of roughly 72–75% of maximum heart rate in the studies that measured fitness gains. Lower than conventional cycling, higher than walking — but real exercise.
McVicar et al. (2022), in a meta-analysis, found that e-biking with moderate assistance elicited a somewhat higher heart-rate response than walking — but the difference was not statistically significant (p = 0.09). E-biking is moderate exercise, but so is a brisk walk; a clear physiological edge over walking has not been demonstrated.
Haufe et al. (2022), tracking 1,879 riders with activity monitors, found that only 22.4% of e-bike users reached the recommended 150 minutes/week of moderate-to-vigorous physical activity, compared to 35% of conventional cyclists. E-biking helps, but less than regular cycling in terms of raw exercise volume.
The UBC REACT Lab study of BC's income-conditioned e-bike rebate program surveyed 1,004 participants over a year and found a 13% increase in travel-related physical activity. This is survey-based self-report — promising but not definitive.
The 12-week Australian trial (published in Health Promotion Journal of Australia) found qualitative mood improvements — participants described the rides lifting their mood, drinking less alcohol, and smoking less. But the sample was 20 participants, there was no control group, and the outcomes were qualitative. It is a pilot study, not a definitive trial.
Evidence on metabolic outcomes — weight, blood pressure, blood lipids — remains inconclusive across systematic reviews (Bourne et al., 2018).
None of this means e-biking is useless for physical health. It means the evidence is early-stage and modest. The honest statement is: e-biking provides moderate-intensity exercise that is accessible to people who are currently inactive, but the physiological benefits compared to other forms of moderate exercise (including walking) are not yet clearly differentiated. The real advantage is not the exercise itself — it is that the other 6 pathways give you a reason to ride in the first place.
What the Research Doesn't Show (Honest Limitations)
Every finding in this article has been cited with its source. But citation is not the same as certainty. Here is what the research does not show, and where the evidence has gaps that intellectual honesty requires acknowledging:
- No large RCT on e-bikes and mental health exists. The 7-pathway model presented here is a synthesis across independent research domains. No single study has tested the full causal chain from "person acquires e-bike" to "mental health improves via these 7 mechanisms." That study has not been run.
- The most-cited e-bike mental health trial was small. The 12-week Australian trial enrolled 20 participants, had no control group, and relied on qualitative interviews. The findings are promising and consistent, but they are not definitive. This is a pilot study.
- UBC data is self-reported. The REACT Lab rebate study surveyed 1,004 program participants. Self-reported data on physical activity and travel is susceptible to recall bias and social desirability bias, and rebate recipients are not a random sample of riders.
- E-biking vs walking: no significant physiological difference. The McVicar et al. (2022) meta-analysis found p = 0.09 for the heart-rate difference. E-biking is moderate exercise, but the claim that it is meaningfully better exercise than walking is not supported by current evidence.
- Metabolic outcomes are inconclusive. Across systematic reviews, evidence that e-biking improves BMI, blood pressure, or blood lipids is inconclusive. The clearest exercise benefit is improved cardiorespiratory fitness in previously inactive individuals (Bourne et al., 2018).
- Most evidence is cross-sectional. The social connection, food security, financial, and transport disadvantage studies cited here demonstrate association, not proven causation. People with transport disadvantage are more likely to be isolated, but randomised experiments assigning people to "have transport" vs "not have transport" do not exist for ethical reasons.
- The SMILES trial (diet and depression) was small. Jacka et al. (2017) enrolled 67 participants, and there was differential attrition between groups. The effect size (d = -1.16) is very large, but replication in larger trials is needed before drawing strong conclusions.
- Winter limits use for 5–6 months in most of Canada. Even with fat tires, most Canadians cannot ride year-round. Extreme cold, ice, and blizzard conditions create real gaps in riding. The mental health pathways described here operate only when the bike is being used. Winter storage means the autonomy, social connection, sunlight, and exercise pathways are interrupted for nearly half the year in many provinces.
- Theft is a real risk. Vancouver police estimate only about 5% of stolen bikes are returned to their owners (CBC, 2018) — registration programs like Project 529 have cut theft substantially, but recovery remains rare. Loss of an e-bike means loss of the mobility — and all 7 pathways — that came with it.
- Battery replacement costs are real. $400–800 every 3–5 years (Zeus editorial estimate), not included in the annual comparison table above. The ~$9,500/year figure is accurate on an annual basis but understates the periodic capital expenditure.
- The 7-pathway model is a framework, not a proven theory. It is a useful synthesis of evidence from multiple domains, but it has not been tested as an integrated model. Each pathway has its own evidence base; the claim that they interact synergistically is reasonable but unproven.
The evidence for each individual pathway is robust — social connection, financial relief, sunlight exposure, food security, autonomy, employment access, and physical activity are all independently associated with better mental health in well-powered studies. The claim that an e-bike can unlock multiple pathways simultaneously is logical and supported by the transport disadvantage literature. But the full chain has not been tested in a single study, most evidence is observational, and the e-bike-specific exercise data is weaker than the general exercise literature. We believe the synthesis is sound. But we are not overselling it.
Frequently Asked Questions
Do e-bikes actually improve mental health?
The direct e-bike-specific evidence is limited — no large randomised controlled trial exists. But e-bikes function as a mobility intervention that unlocks 7 independently documented mental health pathways: autonomy, employment access, social connection, sunlight and outdoor exposure, food security, financial relief, and physical activity. Each pathway has robust peer-reviewed research behind it, linked to its primary source throughout this essay. The combined effect is plausible and well grounded, though no single study has tested the full chain.
How much can a Canadian save by replacing a car with an e-bike?
Statistics Canada's Survey of Household Spending reports the average Canadian household spent $12,090 on transportation in 2023 — up 19.7% from 2021, including $2,567 on gasoline and other fuels. Annual e-bike operating costs run roughly $200–530 (Zeus editorial estimate: electricity, maintenance, optional insurance). For a household that fully replaces a car, the arithmetic gap is roughly $9,500–11,800 per year, before periodic battery replacement of $400–800 every 3–5 years.
Does social connection really affect physical health?
Yes, dramatically. Holt-Lunstad et al. (2010) analysed 148 studies with 308,849 participants: people with stronger social relationships had a 50% increased likelihood of survival — an effect the authors put on par with well-established risk factors such as smoking. Teo et al. (2015, n=11,065) found in-person contact 1–2 times per week was associated with 43% lower odds of later depressive symptoms (OR 0.57); telephone and written or email contact showed no comparable protective effect. You have to physically get to the people who matter.
Is e-biking as good exercise as regular cycling?
No — but it is real exercise. E-cycling elicits roughly 4.9–8.3 METs (Bourne et al. 2018), which qualifies as moderate intensity, though lower than conventional cycling. Only 22.4% of e-bike users reached the 150 min/week moderate-to-vigorous threshold versus 35% of conventional cyclists (Haufe et al. 2022, n=1,879). Against walking, e-biking produced somewhat higher heart-rate responses, but the difference was not statistically significant (McVicar et al. 2022, p=0.09). Evidence on metabolic outcomes such as weight, blood pressure, and blood lipids remains inconclusive.
Can sunlight exposure treat depression?
A JAMA Psychiatry meta-analysis (2025; 11 trials, n=858) found bright light therapy nearly doubled remission in non-seasonal depression — 40.7% versus 23.5% for controls. UK Biobank data from over 400,000 participants shows each additional hour outdoors is associated with 2–8% lower odds of major depression (Burns et al. 2021). Health Canada reports Canadians spend about 90% of their time indoors, and January depression prevalence in Canada is 70% higher than August (Patten et al. 2017). Any activity that gets you outside regularly — including e-biking — increases light exposure.
What is the connection between food security and mental health?
PROOF at the University of Toronto reports that 24% of people in Canada — about 9.8 million, including 2.4 million children — lived in food-insecure households in 2025. Severe food insecurity is associated with 12.4 percentage points more major depressive episodes and 16.0 points more suicidal thoughts (Jessiman-Perreault & McIntyre 2017, n=302,683). In a Baltimore public-housing study, vehicle access was associated with 24% lower risk of food insecurity (Martinez et al. 2019, RR 0.76). Without transport, people rely on convenience stores, where a CDC-published market-basket study found fruit and vegetables 35% and meats 73% more expensive than at supermarkets.
Does lack of transportation cause social isolation?
Transportation is one of the structural causes. A Canadian Journal on Aging scoping review (Lamanna et al. 2020) identifies inadequate transportation as a recognized barrier to social participation for older adults. Delbosc & Currie (2011, n=535) found transport disadvantage was associated with lower subjective wellbeing, with the worst outcomes where it combined with social exclusion. For Canadians without a car — low income, in recovery, new immigrants, seniors who have stopped driving — the inability to physically reach other people is a structural barrier to connection.
What are the honest limitations of e-bike mental health research?
No large randomised controlled trial on e-bikes and mental health exists. The most-cited Australian trial had 20 participants and no control group. The UBC rebate study is survey-based self-report. E-biking's physiological difference from walking is not statistically significant, and evidence on metabolic outcomes is inconclusive. The 7-pathway model is a synthesis across research domains — no single study has tested the full chain, and most evidence shows association, not proven causation. In most of Canada, winter limits riding for months. And theft is real: Vancouver police estimate only about 5% of stolen bikes are returned to their owners.
Sources
Every source below was retrieved and re-verified from the primary on September 1, 2026. Journal articles link to the publisher's version of record via DOI.
Autonomy & transport disadvantage
- Deci, E.L. & Ryan, R.M. (2000). "The 'What' and 'Why' of Goal Pursuits: Human Needs and the Self-Determination of Behavior." Psychological Inquiry, 11(4), 227–268.
- Ng, J.Y.Y. et al. (2012). "Self-Determination Theory Applied to Health Contexts: A Meta-Analysis." Perspectives on Psychological Science, 7(4), 325–340.
- Delbosc, A. & Currie, G. (2011). "Exploring the relative influences of transport disadvantage and social exclusion on well-being." Transport Policy, 18(4), 555–562.
Employment
- Paul, K.I. & Moser, K. (2009). "Unemployment impairs mental health: Meta-analyses." Journal of Vocational Behavior, 74(3), 264–282.
- Gurley, T. & Bruce, D. (2005). "The effects of car access on employment outcomes for welfare recipients." Journal of Urban Economics, 58(2), 250–272.
- Urban Institute, Boosting Upward Mobility framework. "Transportation access" — carrying Kaufman et al. (2015), NYU Rudin Center, on New York City transit access and unemployment.
- Statistics Canada (2025, May 21). "Survey of Household Spending, 2023." The Daily.
Social connection
- Holt-Lunstad, J., Smith, T.B. & Layton, J.B. (2010). "Social relationships and mortality risk: a meta-analytic review." PLoS Medicine, 7(7), e1000316.
- Holt-Lunstad, J. et al. (2015). "Loneliness and social isolation as risk factors for mortality: a meta-analytic review." Perspectives on Psychological Science, 10(2), 227–237.
- Teo, A.R. et al. (2015). "Does Mode of Contact with Different Types of Social Relationships Predict Depression in Older Adults?" Journal of the American Geriatrics Society, 63(10), 2014–2022.
- Statistics Canada (2021, November 24). "Canadian Social Survey: Loneliness in Canada." The Daily.
- Lamanna, M., Klinger, C.A., Liu, A. & Mirza, R.M. (2020). "The Association between Public Transportation and Social Isolation in Older Adults: A Scoping Review of the Literature." Canadian Journal on Aging, 39(3), 393–405.
Sunlight & outdoor exposure
- Burns, A.C. et al. (2021). "Time spent in outdoor light is associated with mood, sleep, and circadian rhythm-related outcomes: A cross-sectional and longitudinal study in over 400,000 UK Biobank participants." Journal of Affective Disorders, 295, 347–352.
- Menegaz de Almeida, A. et al. (2025). "Bright Light Therapy for Nonseasonal Depressive Disorders: A Systematic Review and Meta-Analysis." JAMA Psychiatry, 82(1), 38–46.
- Anglin, R.E. et al. (2013). "Vitamin D deficiency and depression in adults: systematic review and meta-analysis." British Journal of Psychiatry, 202, 100–107.
- Patten, S.B. et al. (2017). "Seasonal variation in major depressive episode prevalence in Canada." Epidemiology and Psychiatric Sciences, 26(2), 169–176.
- Health Canada. "Residential indoor air quality guidelines: Carbon dioxide" — Canadian Human Activity Pattern Survey 2 time-indoors figure.
- Harvard Health Publishing (2022, October 28). "Light therapy: Not just for seasonal depression?"
Food security
- PROOF, University of Toronto (2026, April 29). "New data on household food insecurity in 2025."
- Jessiman-Perreault, G. & McIntyre, L. (2017). "The household food insecurity gradient and potential reductions in adverse population mental health outcomes in Canadian adults." SSM – Population Health, 3, 464–472.
- Martinez, J.C., Clark, J.M. & Gudzune, K.A. (2019). "Association of personal vehicle access with lifestyle habits and food insecurity among public housing residents." Preventive Medicine Reports, 13, 341–345.
- Canales, E., Fan, L., Buys, D.R. & Cantave, M.D. (2021). "A Market Basket Assessment: Prices and Availability of Healthy Foods Across SNAP-Authorized Food Outlets in Counties With High Obesity Rates in Mississippi." Preventing Chronic Disease, 18, 210173.
- Jacka, F.N. et al. (2017). "A randomised controlled trial of dietary improvement for adults with major depression (the 'SMILES' trial)." BMC Medicine, 15, 23.
Financial relief
- Ridley, M., Rao, G., Schilbach, F. & Patel, V. (2020). "Poverty, depression, and anxiety: Causal evidence and mechanisms." Science, 370(6522), eaay0214. Open review summary (MIT).
- Centre for Addiction and Mental Health. "Mental Illness and Addiction: Facts and Statistics."
Physical activity
- Bourne, J.E. et al. (2018). "Health benefits of electrically-assisted cycling: a systematic review." International Journal of Behavioral Nutrition and Physical Activity, 15, 116.
- McVicar, J. et al. (2022). "Systematic review and meta-analysis evaluating the effects electric bikes have on physiological parameters." Scandinavian Journal of Medicine & Science in Sports, 32(7), 1076–1088.
- Haufe, S. et al. (2022). "Impact of electrically assisted bicycles on physical activity and traffic accident risk: a prospective observational study." BMJ Open Sport & Exercise Medicine, 8(4), e001275.
- University of British Columbia (2025, September). "B.C.'s e-bike rebates boost affordability, health and sustainable mobility" — UBC REACT Lab, BC e-bike rebate study.
- Anderson, C.C. et al. (2022). "Health and well-being benefits of e-bike commuting for inactive, overweight people living in regional Australia." Health Promotion Journal of Australia, 33(S1), 349–357.
Theft & ownership risk
- CBC News (2018, October 25). "Bike thefts in Vancouver down 30% thanks to Project 529 registry, police say."
Canada Sends $300B/yr to Foreign Auto Companies · Why Is Canada So Expensive? Follow the Money · Behind the Teen Takeovers: A Loneliness Crisis · Why Is Car Insurance So Expensive in Canada? · How to Save Money in Canada: 9 Programs + 6 Real Fixes
All photography by Playcut.ai — personalised AI actor technology.

Share:
Best Hunting eBikes Canada (2026): 6 Silent, All-Terrain Picks for the Bush
“Too-Cheap” Ridstar e-bikes on Amazon.ca: What Canadian Shoppers Are Reporting, What’s Verifiable, and How to Protect Yourself